CIO Letter – Aug 2025: Markets melt-up continued but caution remains

Highlights:
#1
Riding on the positive sentiment in the global equity market, the S&P 500 and ACWI continued their rally and closed the month for July with gains of +2.17% and +1.06% respectively.
#2
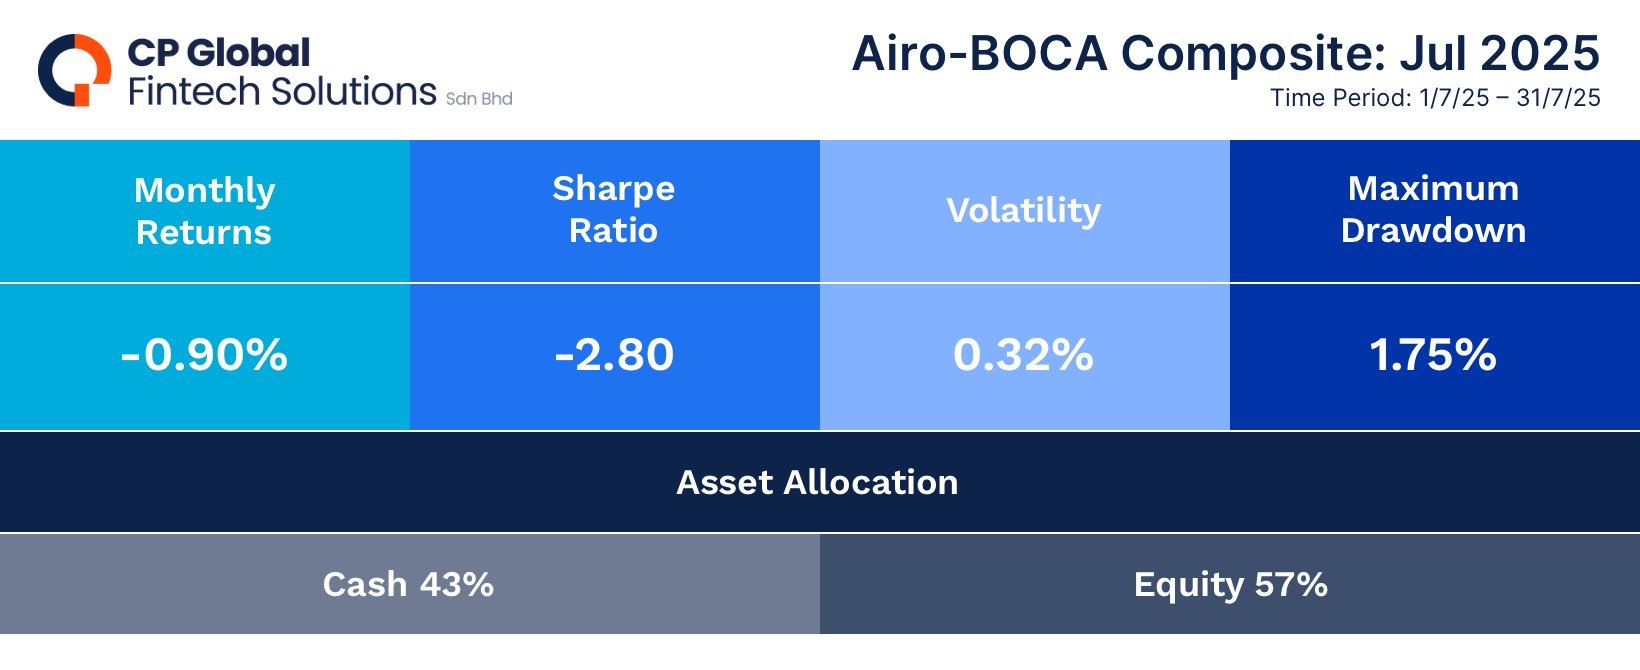
The Airo-BOCA Composite declined by -0.90%, primarily due to an existing hedging position. On the other hand, the Airo-Shariah Composite gained +1.75%, driven by sustained exposure to U.S. equity ETFs and technology stocks.
#3
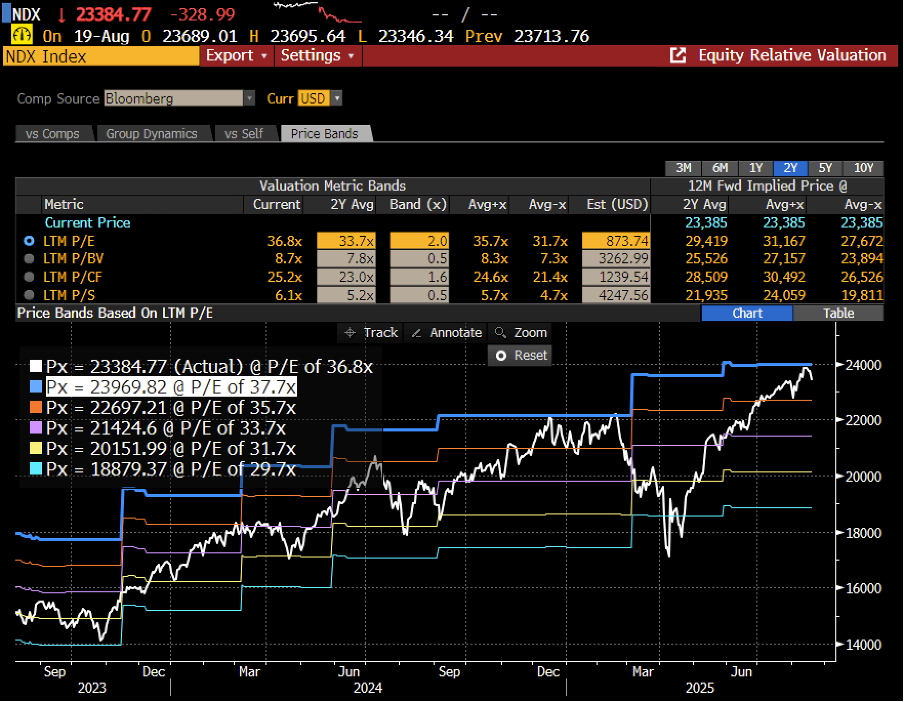
From a valuation perspective, the Nasdaq-100 is trading near the upper end of its P/E band over the past two years, continuing to signal frothy valuations in the technology sector–one of the key drivers of the U.S. equity market rally.
#4
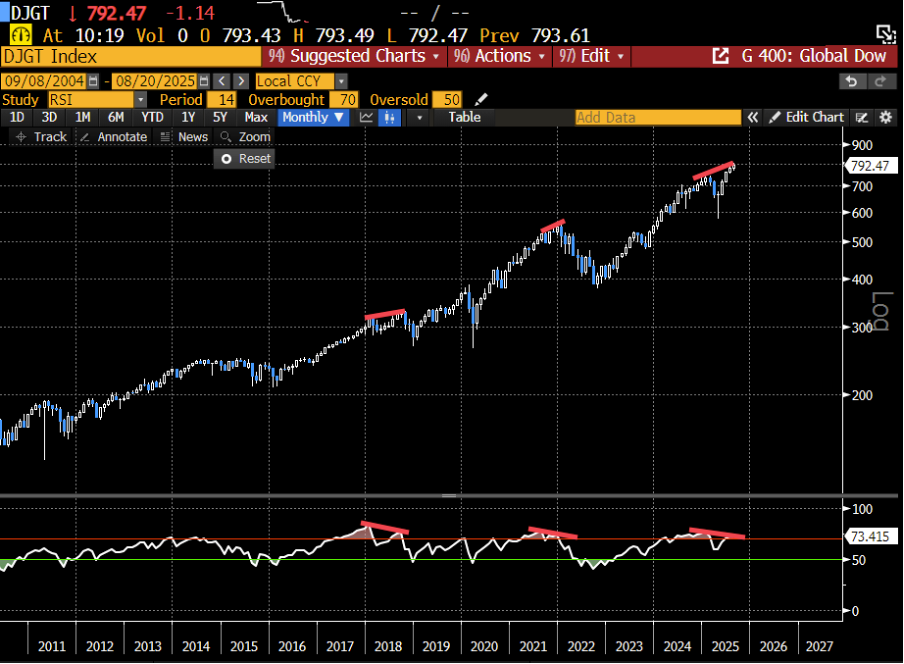
The Global Dow Index continued to show broad-base negative divergence between price and momentum, signaling that a potential correction may be on the horizon.
#5
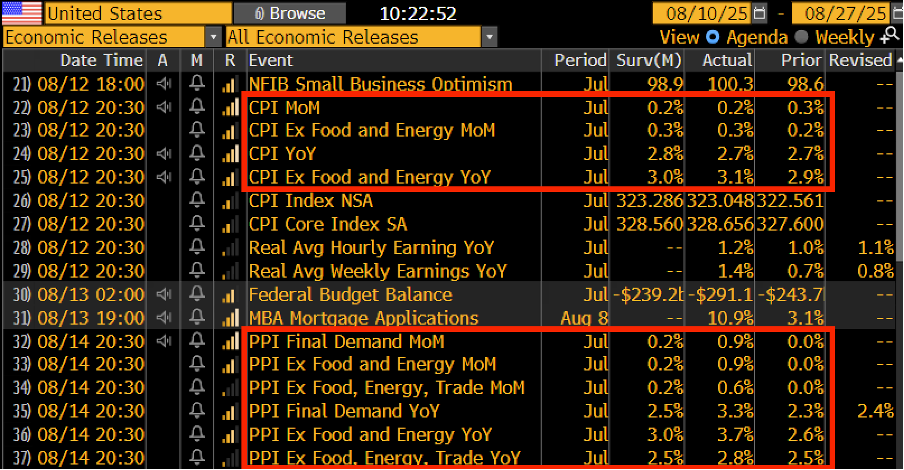
At the macro level, the impact of U.S. tariffs appears to be delayed, as pass-through effects have yet to show up in consumer prices. Notably, the latest Producer Price Index (PPI) posted a significant jump, suggesting that companies have thus far been absorbing the increased input costs from tariffs.
#6
While the U.S. equity market continues its upward melt-up, we remain cautious given the macro backdrop–particularly the potential delayed impact of U.S. tariffs that has yet to fully materialize.
– – –
Dear Valued Investors,
Riding on the positive sentiment in the global equity market, the S&P 500 and ACWI continued their rally and closed the month for July with gains of +2.17% and +1.06% respectively. In comparison, the Airo-BOCA Composite declined by -0.90%, primarily due to an existing hedging position. On the other hand, the Airo-Shariah Composite gained +1.75%, driven by sustained exposure to U.S. equities and technology stocks.

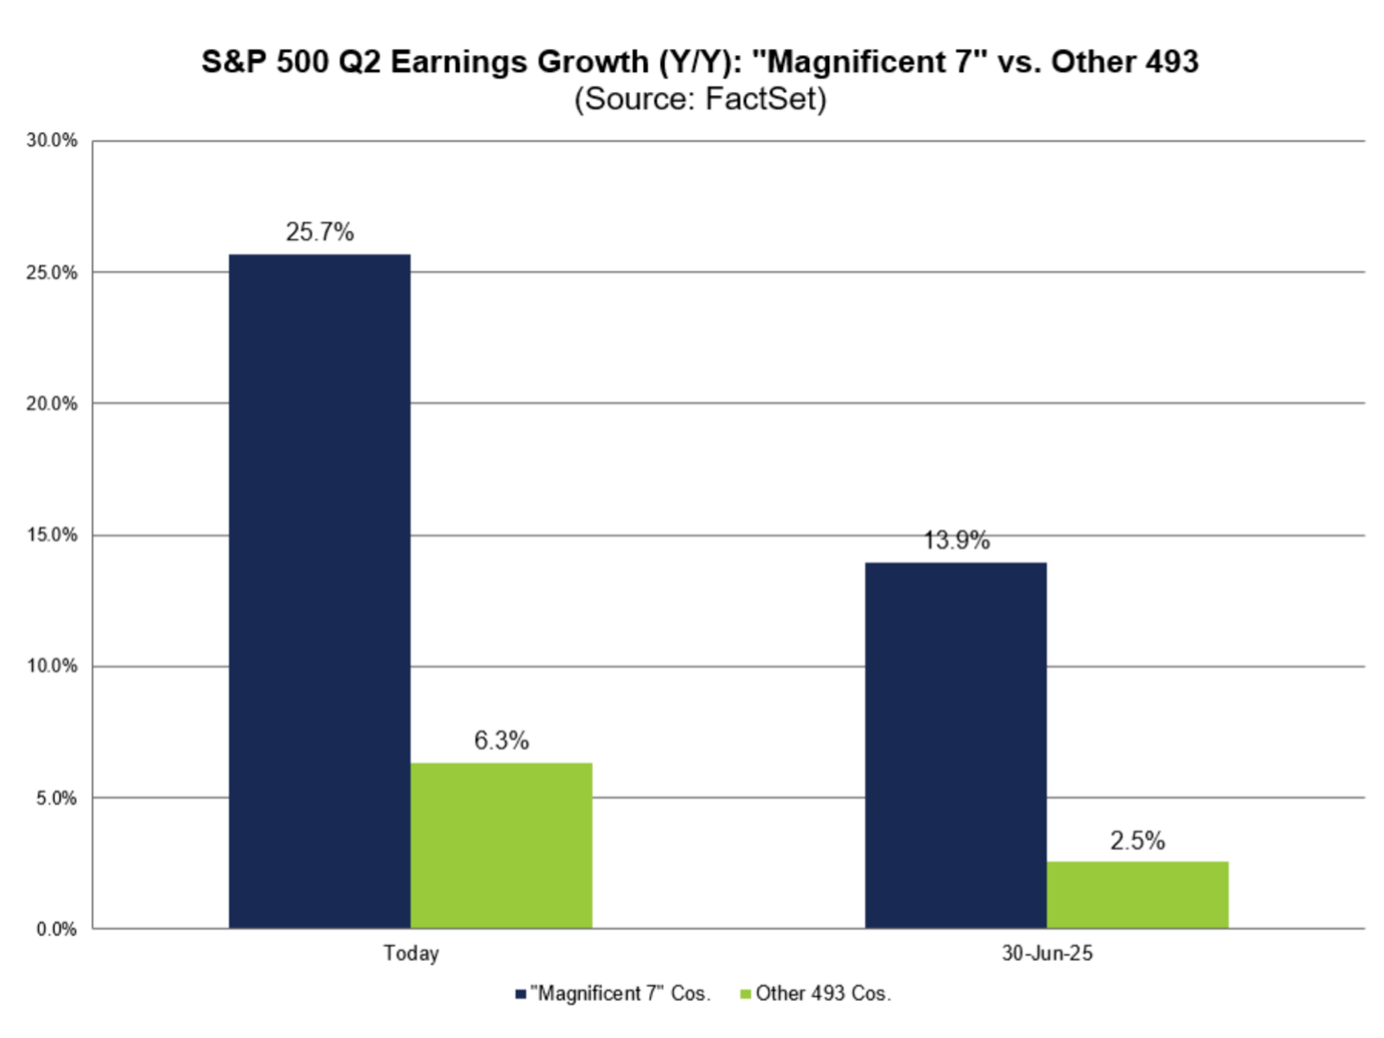
While S&P 500’s Q2 earnings growth remained intact, the gains were mainly concentrated in the ‘Magnificent7’–primarily AI-related stocks. Excluding these, the S&P 500’s EPS growth was limited to low single digits.
Chart 1: Excluding the Magnificent7, S&P 500’s earnings growth would be a low single digit
Indeed, from a valuation perspective, the Nasdaq-100 is currently trading near the top end of its P/E band over the past two years–continuing to signal frothy valuations in the technology sector that has fueled the U.S. equity market rally.
Chart 2: Nasdaq100 is trading at its top end of valuation
At the same time, the Global Dow Index continued to exhibit a broad-based negative divergence between price and waning momentum–likewise signaling that a potential correction may be incoming.
Chart 3: Global Dow index’s negative momentum divergence remains intact
At the macro level, the impact of U.S. tariffs appears to be delayed, as the pass-through to consumer prices has yet to materialize. Notably, the latest Producer Price Index (PPI) recorded a significant jump–supporting the view that companies have been absorbing the increased input costs stemming from tariffs.
Chart 4: PPI saw a big jump that showed companies have been absorbing the tariff input costs
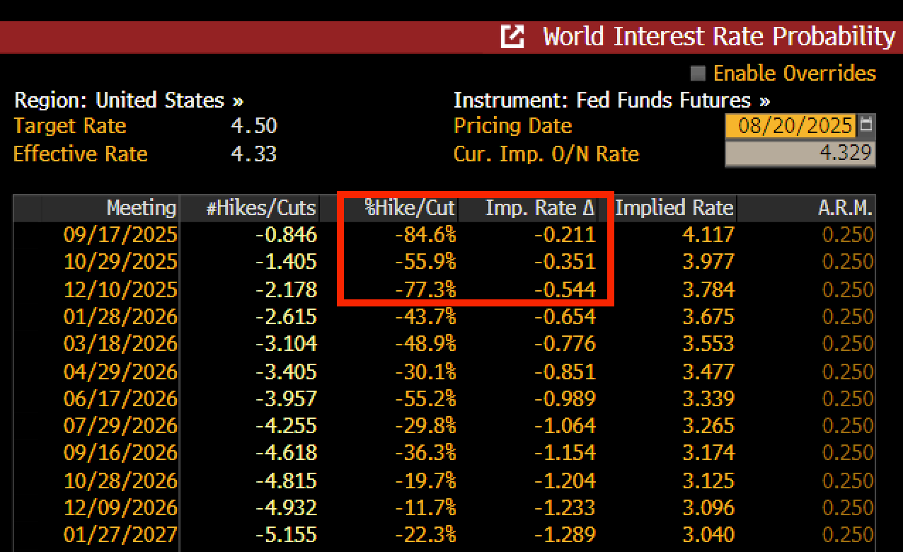
Lastly, the U.S. equity market has likely priced in the upcoming interest rate cut cycle expected to re-start in September 2025. However, given the recent rally, we remain cautious amid the macro backdrop–particularly the delayed impact of U.S tariffs.
Chart 5: Market is pricing-in two interest rate cuts of -0.25% each by the end of 2025
August 20th, 2025
William Yii
CIO, CP Global Fintech Solutions
– – –
Disclaimer: Airo is a brand of CP Global Fintech Solutions Sdn Bhd (“CPFS”), licensed by the Securities Commission of Malaysia as a Digital Investment Management company. CPFS is authorised to carry out the business of fund management incorporating innovative technologies into automated discretionary portfolio management services offered to clients under a license issued pursuant to Schedule 2 of the Capital Markets Services Act 2007.
All investing involves risk, including the possible loss of money you invest, and past performance does not guarantee future performance. Historical returns, expected returns, and probability projections are provided for informational and illustrative purposes, and may not reflect actual future performance. CPFS assumes no responsibility for liability for your trading and investment results. It should not be assumed that the methods, techniques, or indicators presented in these products will be profitable, or that they will not result in losses. Past results of any trading system published by CPFS, are not indicative of future returns by that system, and are not indicative of future returns which will be realised by you.