CIO Letter – Feb 2025: Navigating Macro Uncertainty and Micro Challenges

Highlights:
#1
The initial selloff in early January triggered a buy-on-dip sentiment, as the market interpreted Trump’s tariff rhetoric as a short-term negotiation tactic in global trade discussions rather than a signal of outright escalation.
#2
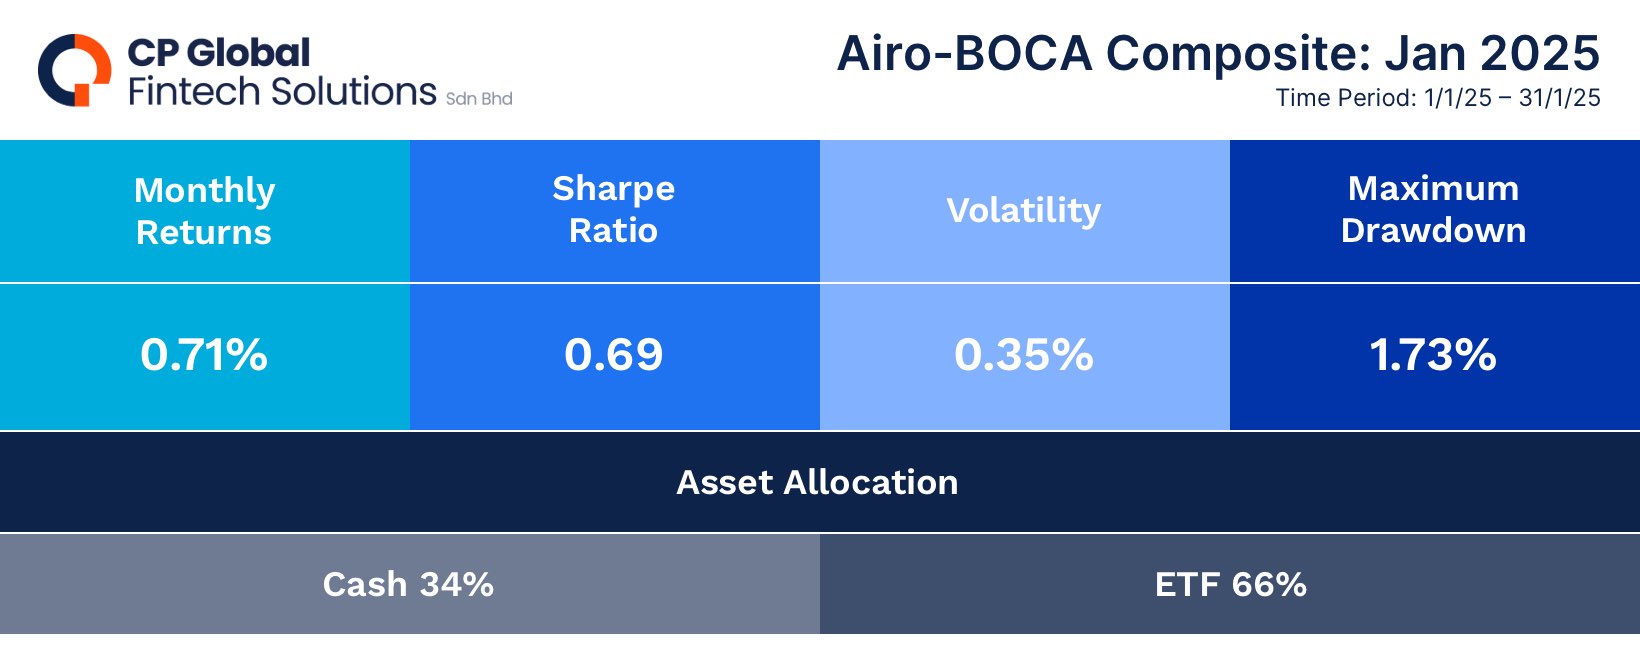
As a result, the MSCI ACWI and S&P 500 indices closed higher, gaining +3.14% and +2.70%, respectively. The Airo-BOCA composite likewise returned positively at +0.71%, although overall performance was weighed down by certain hedging positions.
#3
From a macro perspective, key risk factors for global equity markets include Trump’s tariff rhetoric, persistent U.S. inflation, and Japan’s ongoing elevated inflation. Trump imposed several tariffs targeting both allies (Canada and Mexico) and rivals (China), although the actual implementation of these tariffs is delayed.
#4
Lastly, with Japan’s strong inflation and solid economic growth, a further appreciation of the Yen appears likely, as the Bank of Japan is expected to continue its interest rate hike normalization to curb rising inflationary pressures. However, as previously mentioned, a significantly stronger Yen raises the risk of a Yen carry trade unwinding, which could spark a global selloff in risk assets.
#5
On the micro front, U.S. corporations have released their 4Q 2024 earnings results. Notably, the ‘Magnificent 7’ delivered underwhelming performance, with management providing forward sales guidance that fell short of consensus expectations.
– – –
Dear Valued Investor,
Following the selling volatility in December 2024, financial markets extended the selloff into early January. However, sentiment shifted to a buy-on-dip mode from mid-January onward, driving U.S. markets higher by month-end. A key catalyst for the January rally was the market’s perception that Trump’s tariff threats were a short-term negotiating tactic used in global trade discussions rather than a signal of outright escalation.
As a result, the MSCI ACWI and S&P 500 indices closed higher, gaining +3.14% and +2.70%, respectively, as markets largely dismissed the tariff rhetoric as non-threatening for the time being. Similarly, the Airo-BOCA composite returned positively at +0.71%, though overall performance was weighed down by certain hedging positions. Looking ahead, the S&P 500’s price action suggests that an absolute peak for 2025 may arrive sooner rather than later, particularly as its price trend begins to diverge from its earnings growth trajectory.
Chart 1: S&P500 is potentially churning at its absolute peak in 2025
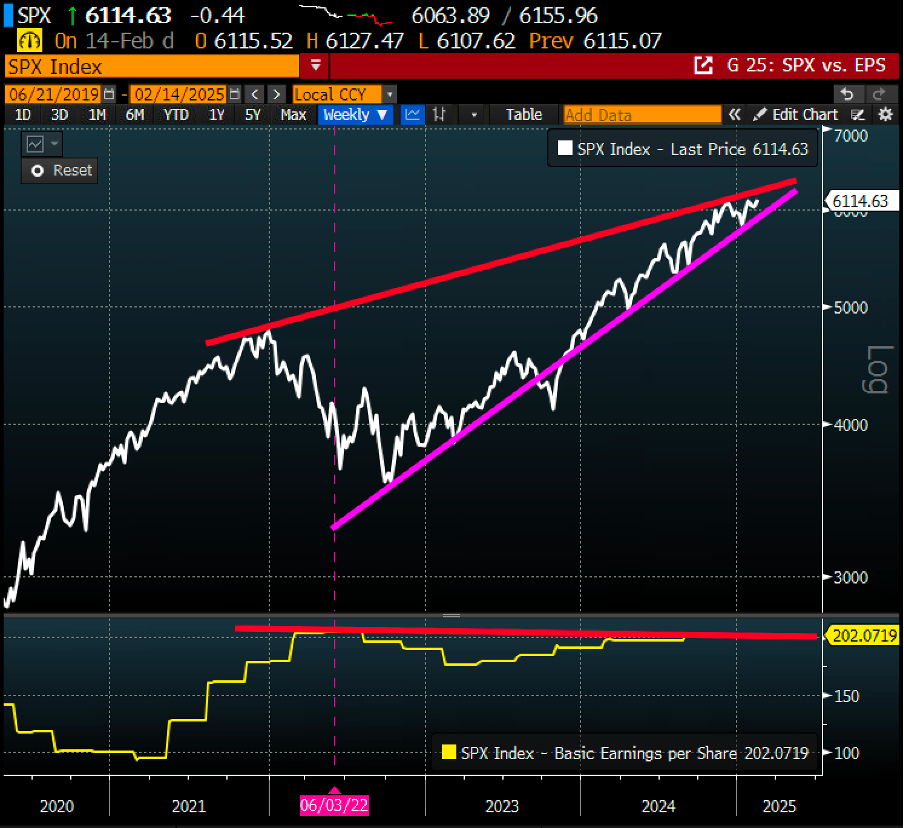
Table 1: Airo-BOCA Composite Return (January 2025)
From a macro perspective, key risk factors for global equity markets include Trump’s tariff rhetoric, persistent U.S. inflation, and Japan’s elevated inflation. Trump has approved several tariffs, including a 25% levy on imports from allies Canada and Mexico, and a proposed 10% tariff on certain Chinese commodities. However, with the tariff implementation still pending, Trump is providing counterparties ample time to negotiate. As a result, market participants are implicitly anticipating potential trade agreements rather than a full-scale tariff rollout.
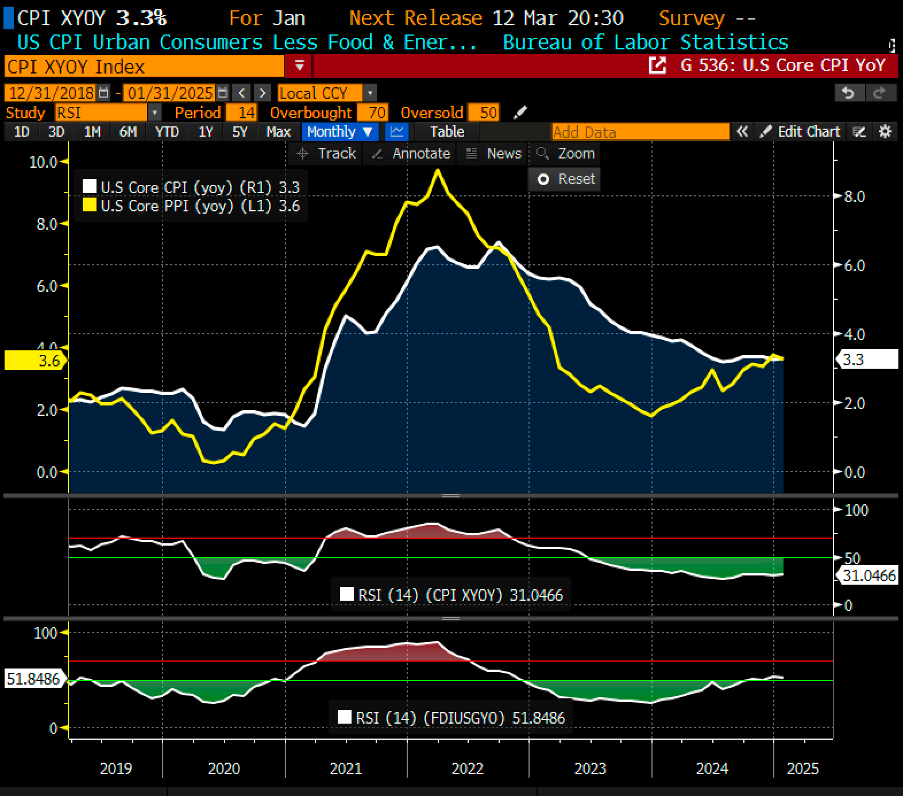
Regarding the U.S. inflation trajectory, January 2025’s headline Consumer Price Index (CPI) surged by +0.5% month-on-month, marking the highest increase since August 2023. Similarly, core CPI remained sticky, rising to 3.3% year-on-year. In addition, both headline and core Producer Price Index (PPI) figures reflected a more hawkish outlook, registering 3.5% and 3.6% year-on-year, respectively. In summary, these inflation indicators suggest that the Fed.’s preferred inflation gauge i.e. the core Personal Consumption Expenditure (PCE) deflator may turn out to be just as hawkish. If this trend persists, not only will the probability of a rate cut continue to diminish, but expectations could shift toward the possibility of a rate hike instead!
Chart 2: Both U.S Core CPI & Core PPI are turning higher above 3.0% yoy
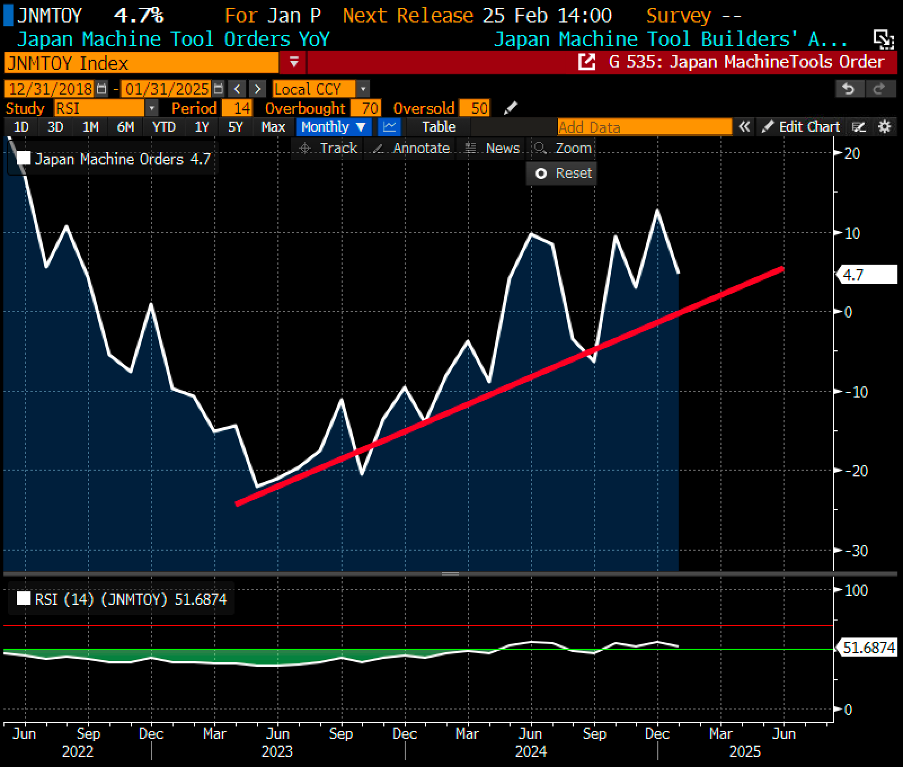
Japan’s inflation and growth data remain robust, with core CPI and headline PPI continuing to rise strongly above +3% year-on-year, while growth indicators, such as machinery orders, show steady expansion. Additionally, Japan’s 4Q 2024 GDP growth surprised to the upside, accelerating to an annualized 2.8%, up from 1.2% in 3Q 2024! In summary, Japan’s solid macroeconomic data further support the Bank of Japan’s efforts to normalize interest rates, aiming to tackle inflationary pressures more effectively from the current interest rate of just 0.50%.
Chart 3: Japan Core CPI & Core PPI are trending up consistently at 3.0% yoy & above
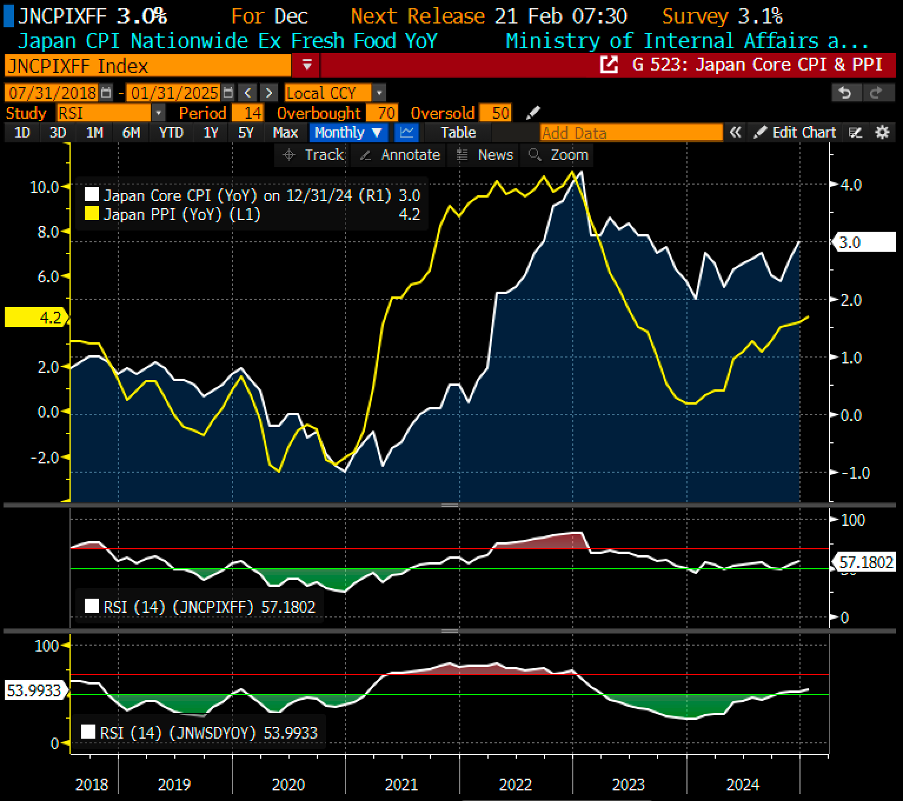
Chart 4: Japan machinery order has been growing consistently
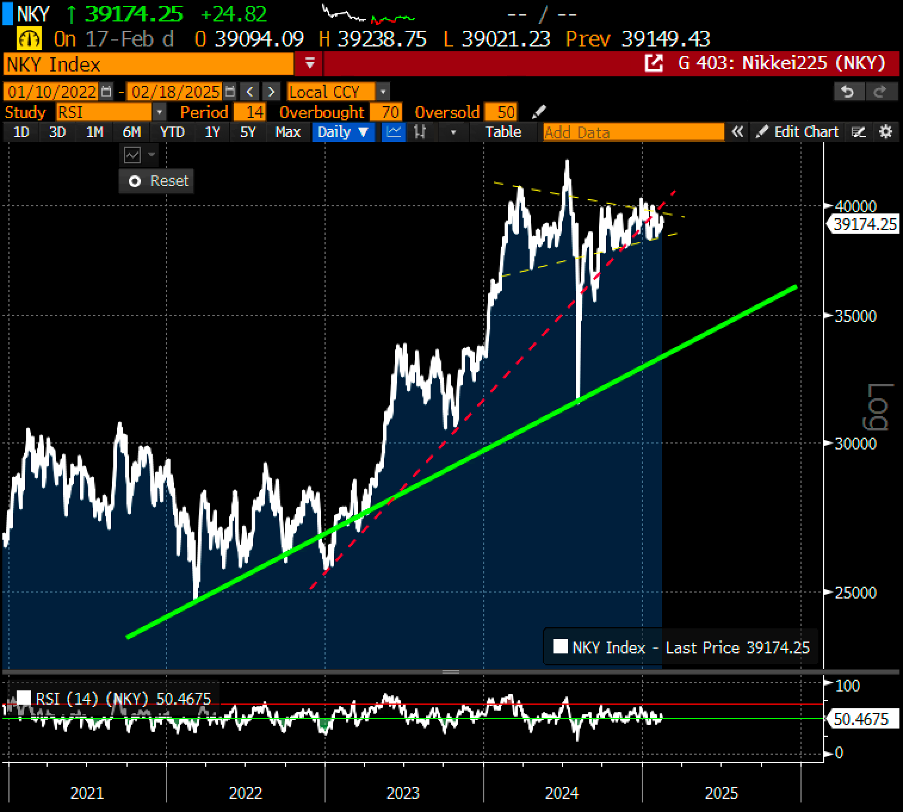
It is important to emphasize once again that while a continuous interest rate hike is typically bullish for the Yen, its impact on Japanese equities may be far less favorable. For years, Japan’s relatively weaker Yen against other currencies has fueled carry trade investments. Therefore, a prolonged unwinding of the Yen as a carry trade currency poses a clear and present danger to global risk assets, as it could potentially trigger another selloff in Japanese equities–or even a broader global equity market decline.
Chart 5: Market consensus is expecting USDJPY to hit 148 by the end of 2025
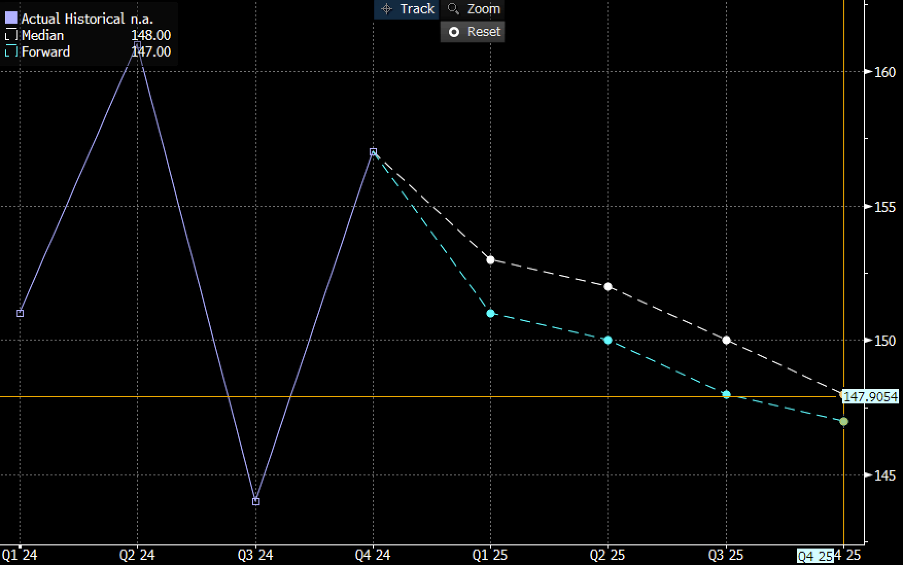
Chart 6: Nikkei225 remains in a tight range that is awaiting a breakout. But, which way?
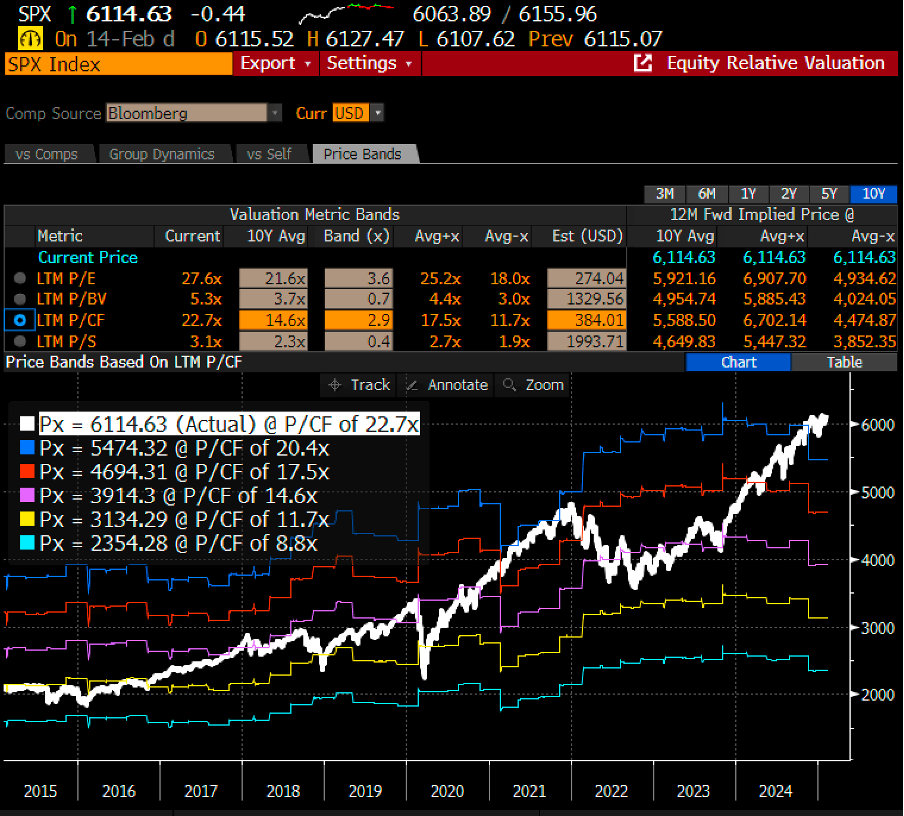
Lastly, on the micro front, U.S. corporations have released their 4Q 2024 earnings results. Notably, the ‘Magnificent 7’ delivered underwhelming management guidance, with forward revenue projections falling short of consensus expectations. This highlights a clear dislocation between a weaker earnings outlook and the current S&P 500 valuation, which remains at the upper end of its historical bands across multiple metrics, including price-to-earnings (P/E), price-to-book (P/B), price-to-cash flow (P/C), and price-to-sales (P/S) ratios.
Chart 7: S&P500 is trading circa +2-sigma of its 10Y average P/E band
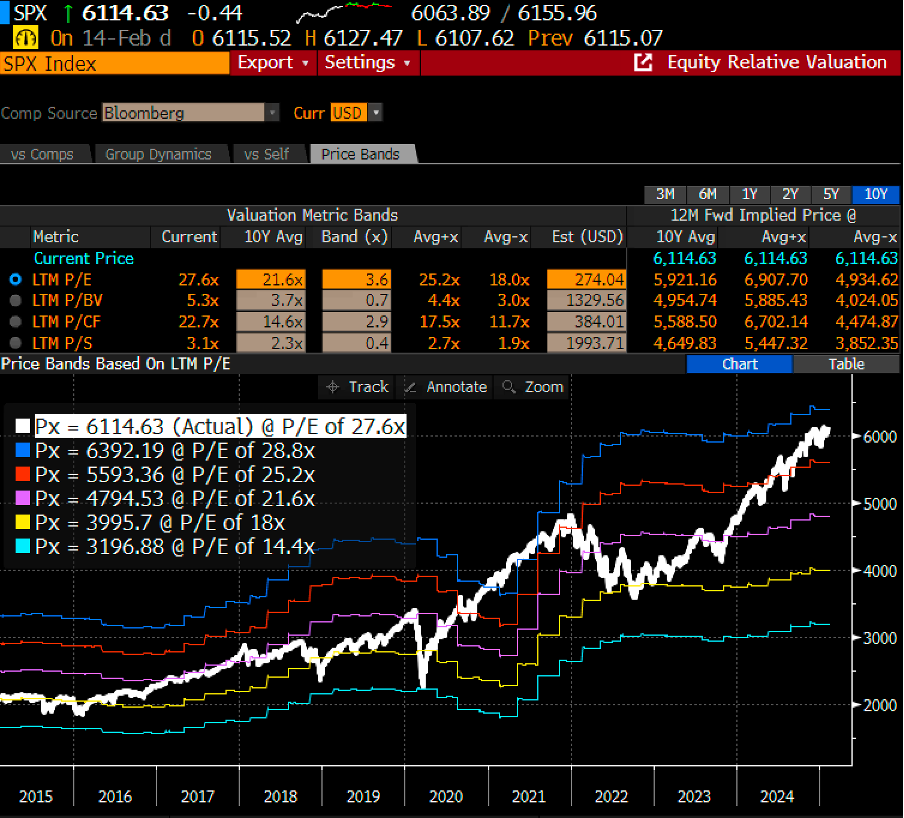
Chart 8: S&P500 is trading above the +2-sigma of its 10Y average P/S band
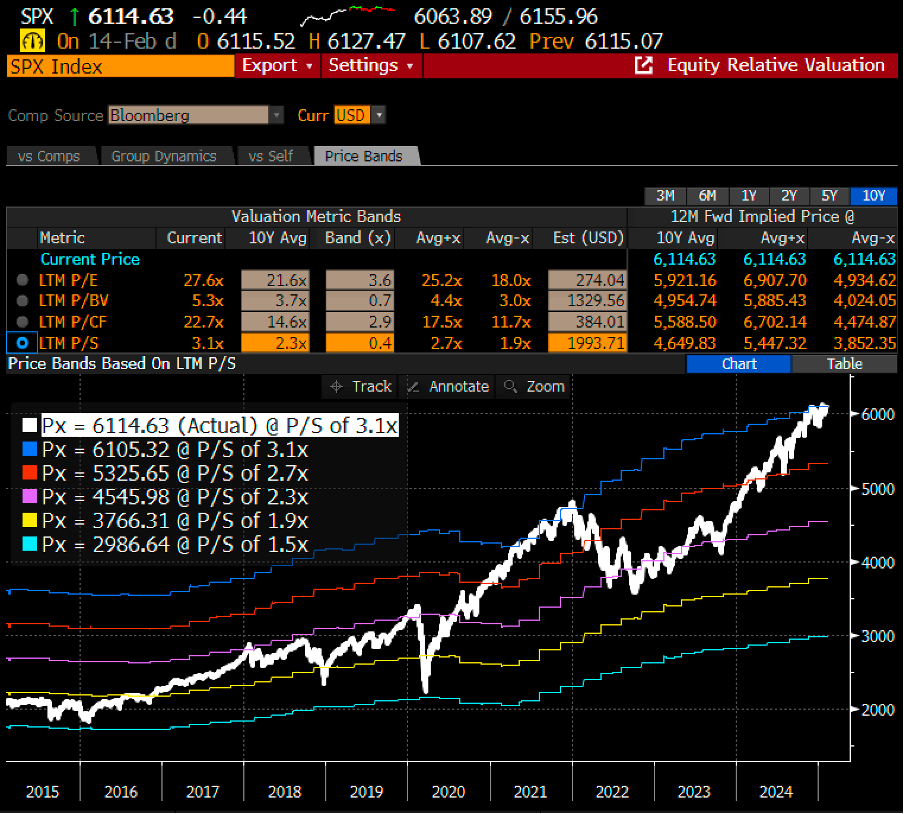
Chart 9: S&P500 is trading above the +2-sigma of its 10Y average P/CF band
February 18th, 2025
William Yii
CIO, CP Global Fintech Solutions.
– – –
Disclaimer: Airo is a brand of CP Global Fintech Solutions Sdn Bhd (“CPFS”), licensed by the Securities Commission of Malaysia as a Digital Investment Management company. CPFS is authorised to carry out the business of fund management incorporating innovative technologies into automated discretionary portfolio management services offered to clients under a license issued pursuant to Schedule 2 of the Capital Markets Services Act 2007.
All investing involves risk, including the possible loss of money you invest, and past performance does not guarantee future performance. Historical returns, expected returns, and probability projections are provided for informational and illustrative purposes, and may not reflect actual future performance. CPFS assumes no responsibility for liability for your trading and investment results. It should not be assumed that the methods, techniques, or indicators presented in these products will be profitable, or that they will not result in losses. Past results of any trading system published by CPFS, are not indicative of future returns by that system, and are not indicative of future returns which will be realized by you.