CIO Letter – Jul 2023: Is equity poised for further rallies or potential challenges ahead?
 – – –
– – –
Highlights:
#1
For June 2023, Airo-BOCA composite was down -2.15% while MSCI All Country World Index (ACWI) and S&P500 Index (SPX) were up +4.32% & +6.47% respectively. Airo’s performance was affected by short positions in technology and small-cap stocks.
#2
In perspective, Apple’s share price had hit a new all-time-high, which can be interpreted in two ways. It could either indicate that the market has already factored in a highly optimistic earnings outlook, or it may be a result of excessive valuation driven by the abundant liquidity despite the Fed’s tightening measures.
#3
From a macro perspective and given the current pricing of U.S equities, the U.S. market appears to have entirely dismissed the possibility of a recession. Additionally, the sentiment surrounding U.S. equities is nearing the level of “extreme greed,” that warrants a need for caution.
#4
Given the aforementioned circumstances, Airo remains cautious and prepared for potential risks that may topple the current equity rally.
– – –
Dear Valued Investors,
For June 2023, Airo-BOCA composite was down -2.15% while MSCI All Country World Index (ACWI) and S&P500 Index (SPX) were up +4.32% & +6.47% respectively. Airo’s performance was affected by short positions in technology and small-cap stocks.
Table 1: On a year-to-date basis, Airo-BOCA returned -3.06% (As of June 2023)
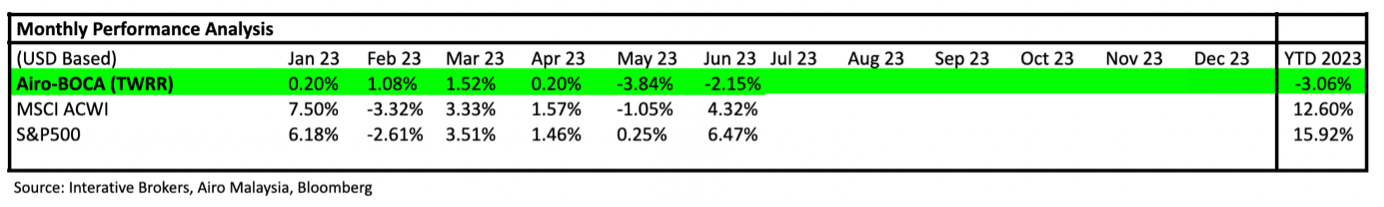
Source: Interactive Brokers, Airo Malaysia, Bloomberg.
In perspective, Apple’s share price had hit a new all-time-high. This translates into a valuation of 32x PE with a 12-month forward earnings growth trajectory of a mere +8% (i.e. a clear dislocation between equity prices vs. growth’s expectation). On the other hand, as the Fed. continued to tighten its balance sheet, the Fed.’s net liquidity, however, remained positive and has been driving the U.S equity market higher. In other words, valuation exuberance seems to be the key driver as a result of ample liquidity remaining.
Chart 1: Apple’s Valuation ~ at new all-time-high!
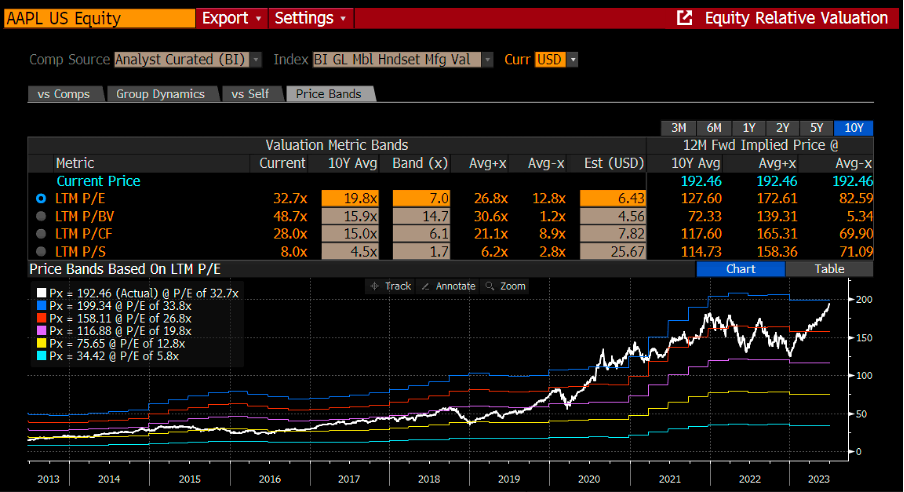
Source: Airo Malaysia, Bloomberg.
Chart 2: Fed.’s Net Liquidity ~ positively driving the U.S equity market.
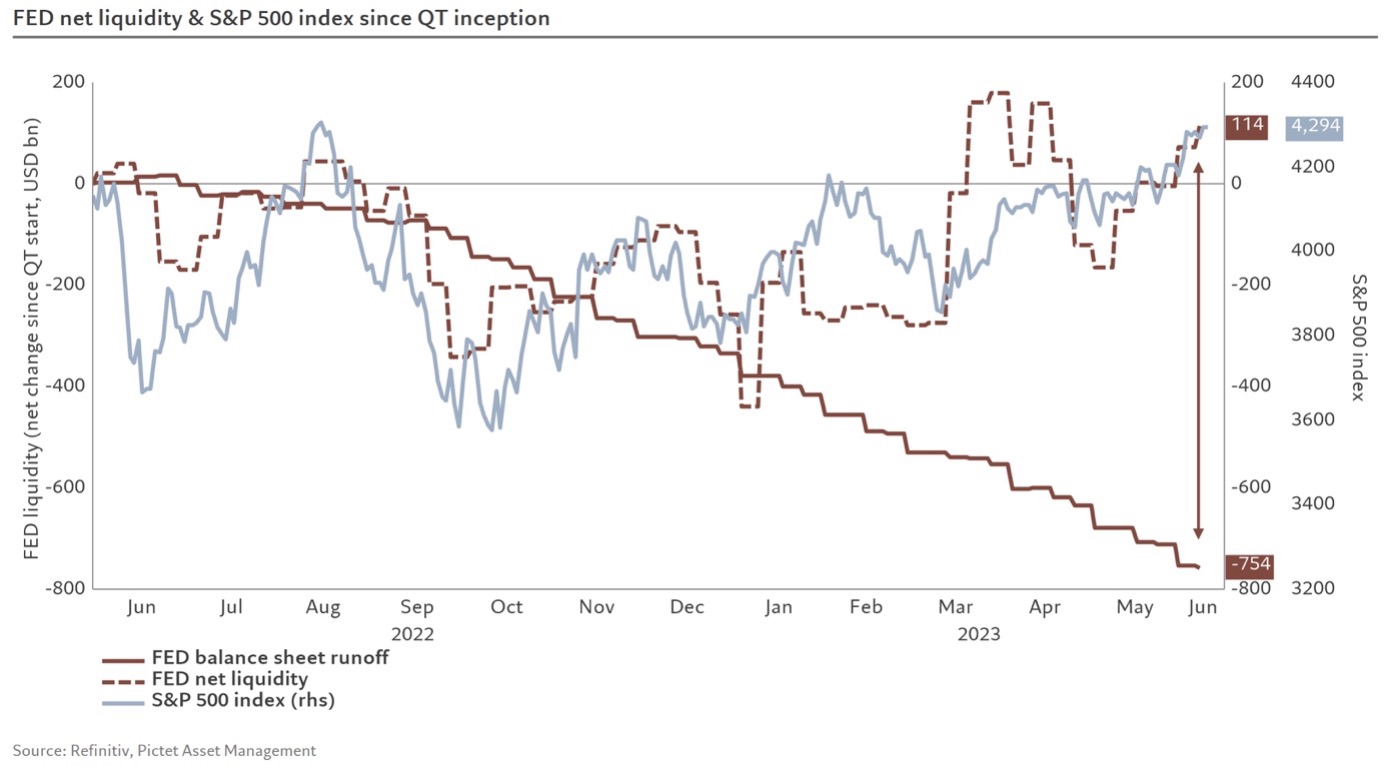
Source: Refinitiv, Pictet Asset Management.
From a macro perspective and given the current pricing of U.S equities, the U.S. market appears to have entirely dismissed the possibility of a recession. From a historical perspective, the following charts showed that the initial rally on rate hike cycle pausing was either due to a broad-base recovery in the economy or a case of technical rally followed by more corrections on recessionary scenarios.
Chart 3: Rate Hike Pause vs. S&P500 Rally ~ historical perspective 1970 to 2018
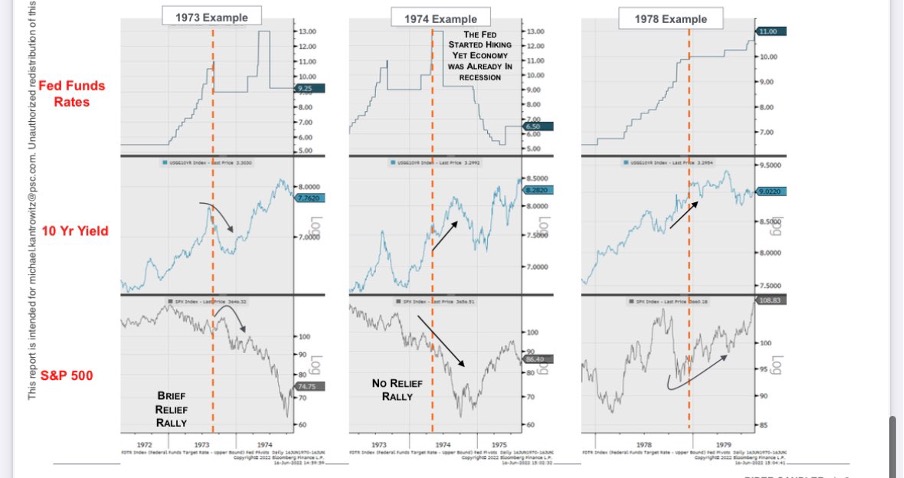
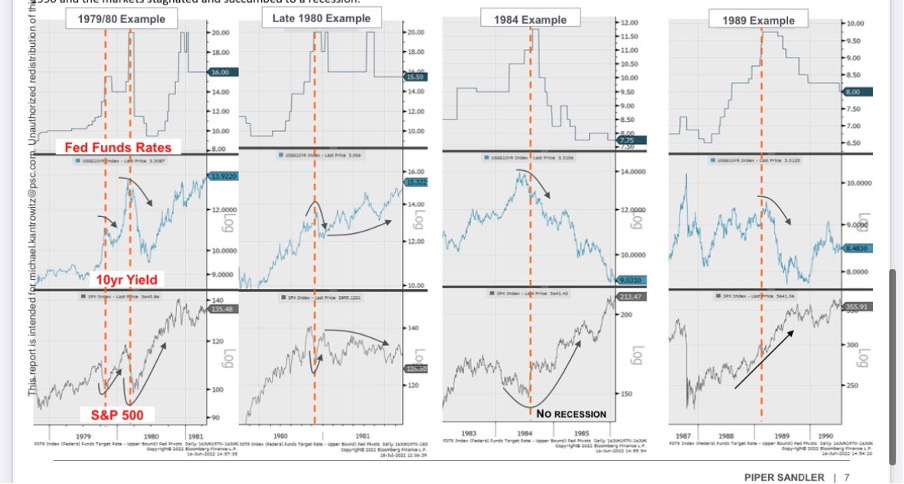
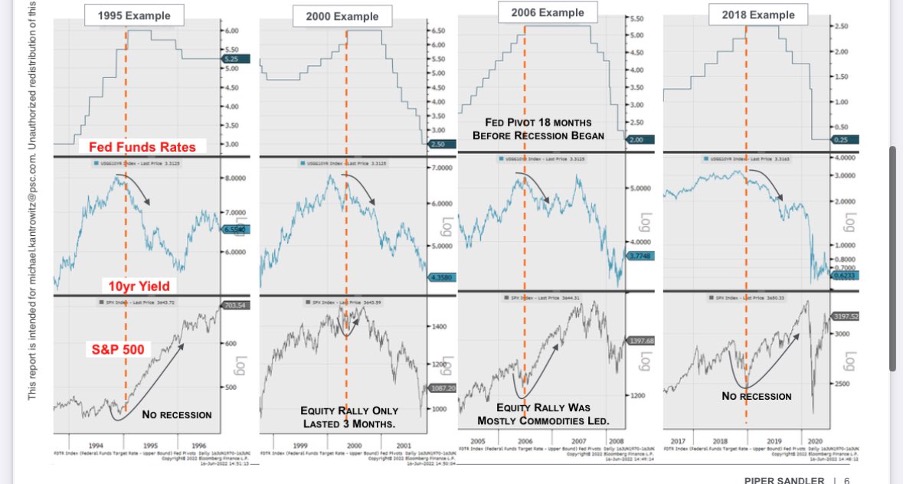
Source: Piper Sandler Research
At the same time, the U.S equity market is currently churning at the extreme end of its positive sentiment level as shown by the Morgan Stanley Market Sentiment indicator. This is a typical sign of an imminent equity price exuberance condition.
Chart 4: Morgan Stanley Market Sentiment Indicator ~ at “extreme greed” level.
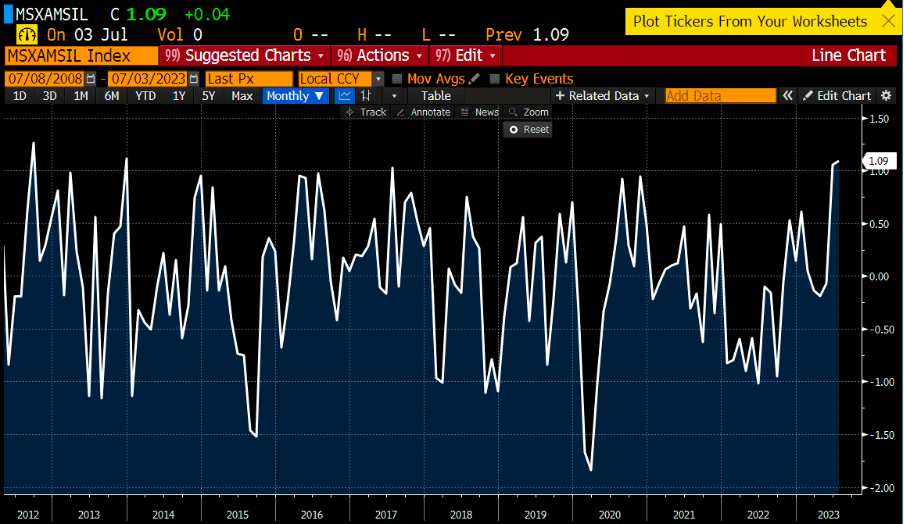
Source: Airo Malaysia, Bloomberg.
Given the aforementioned circumstances, Airo remains cautious and prepared for potential risks that may topple the current equity rally.
July 5th, 2023
William Yii
CIO, Airo Malaysia
– – –
Disclaimer: Airo is a brand of BH Global Fintech Solutions Sdn Bhd (“BHFS”), licensed by the Securities Commission of Malaysia as a Digital Investment Management company. BHFS is authorised to carry out the business of fund management incorporating innovative technologies into automated discretionary portfolio management services offered to clients under a license issued pursuant to Schedule 2 of the Capital Markets Services Act 2007.
All investing involves risk, including the possible loss of money you invest, and past performance does not guarantee future performance. Historical returns, expected returns, and probability projections are provided for informational and illustrative purposes, and may not reflect actual future performance. BHFS assumes no responsibility for liability for your trading and investment results. It should not be assumed that the methods, techniques, or indicators presented in these products will be profitable, or that they will not result in losses. Past results of any trading system published by BHFS, are not indicative of future returns by that system, and are not indicative of future returns which will be realized by you.