CIO Letter – Jul 2024: Increasing Concerns Over Macro-Micro Disconnect!

Highlights:
#1
Driven by the Magnificent7’s rally, the S&P500 continued churning higher in June, closing up by +3.47%. In contrast, China equity SHSZ300 fell by -3.64% for the month, as China’s macro recovery remained bumpy.
#2
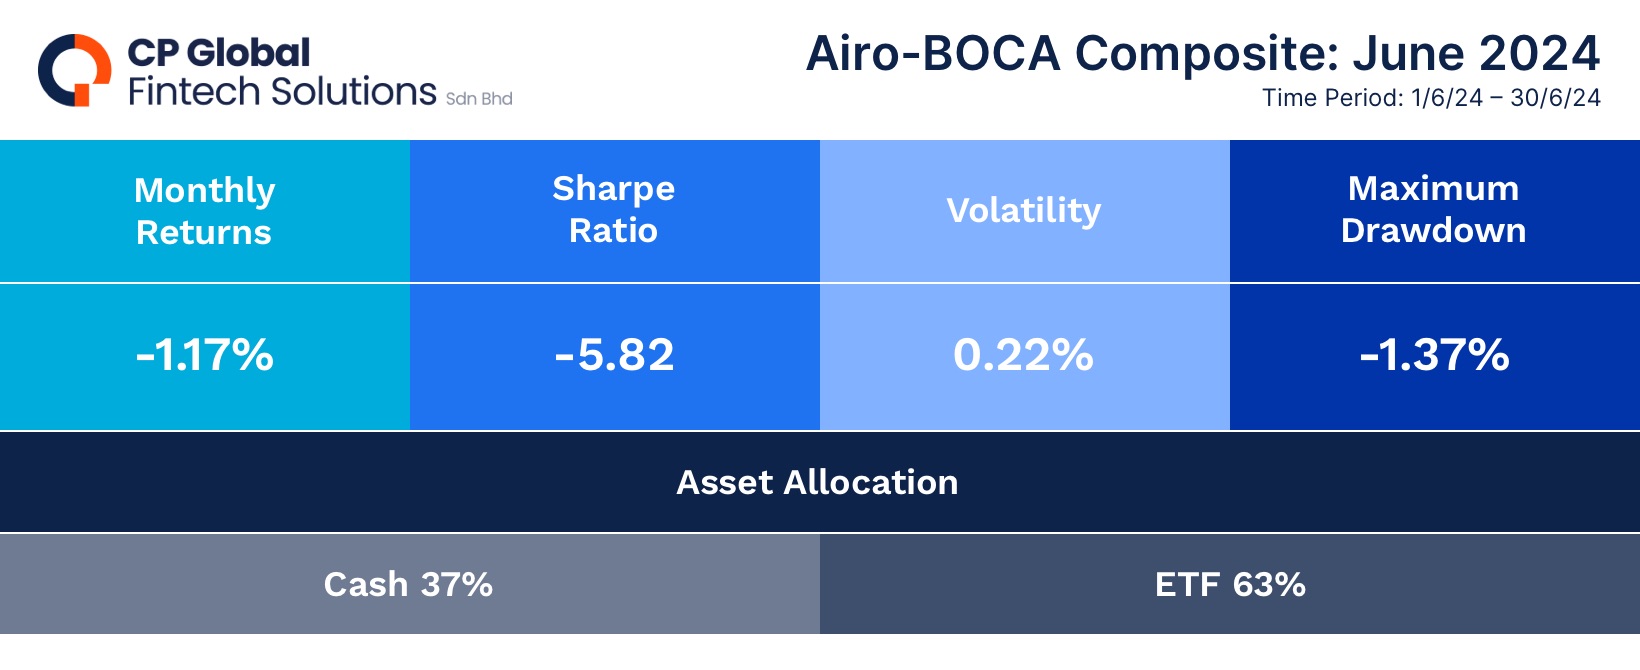
Due to a drag from the China equity, rare earth, and agricultural business sectors, as well as cutting loss in the volatile Cannabis sector, Airo-BOCA took a hit at -1.17% in June. We anticipate that performance volatility will improve as we exited these volatile sectors.
#3
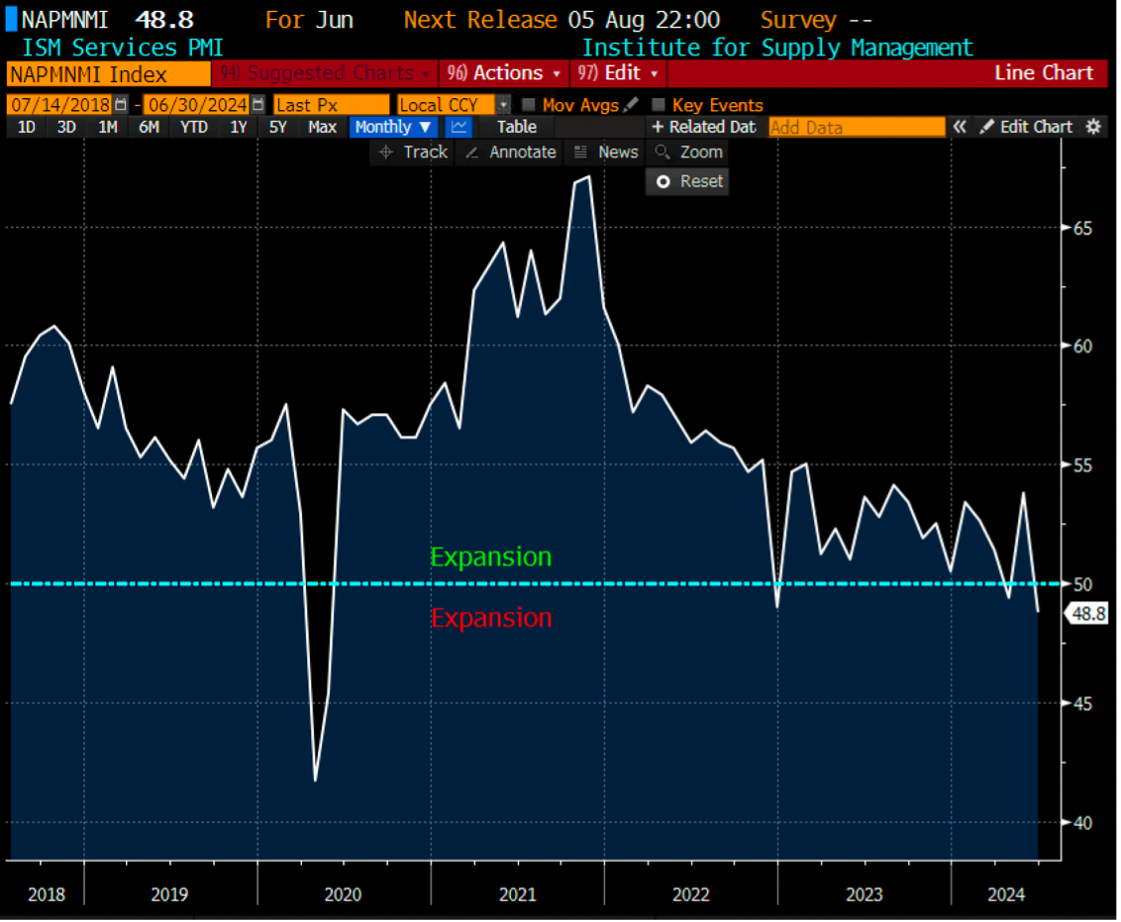
U.S macro growth continued to reverse into contraction, as indicated by the ISM Manufacturing PMI, which contracted for the third consecutive month. Additionally, the ISM Services PMI unexpectedly slipped into contraction for the first time since 2022.
#4
The big picture indicates that the U.S macro growth cycle has come to an end. The disconnect between U.S equity performance and reversing macro growth can be attributed to the lagging effect from a macro to micro level.
#5
The rapidly deteriorating U.S labour market growth and the disinflation trend turning deflationary are direct consequences of the slowing U.S macro growth. This scenario is positive for the U.S fixed income sector but increasingly risky for the U.S equity sector, given current valuations.
#6
Airo has a substantial weighting in the fixed income sector and may look to increase this further, given the clear peak of the U.S interest rate cycle. On the other hand, we will remain nimble with our overall equity exposure and consider deploying tactical hedging strategies carefully.
– – –
Dear Valued Investors,
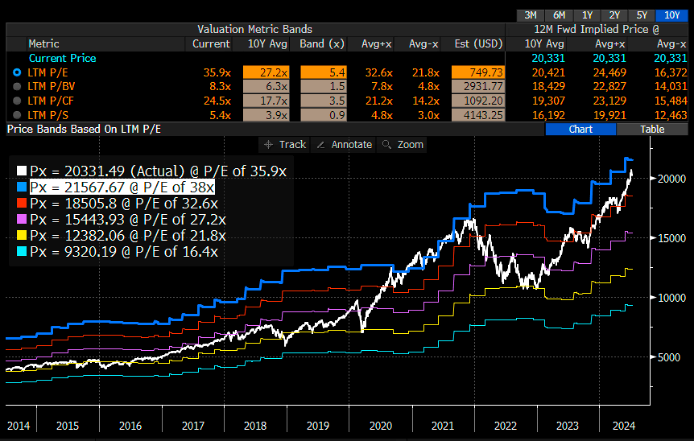
As the U.S’ biggest technology stocks i.e. Magnificent7 continued to rally, the S&P500 index closed the month of June higher at +3.47%. For context, the Nasdaq100 index is currently trading around its most expensive valuation PE band. What this means is that there is no margin for error when the technology companies are due to report their 2Q earnings results in the next couple of weeks.
Chart 1: Nasdaq100 ~ trading at the most expensive valuation in history
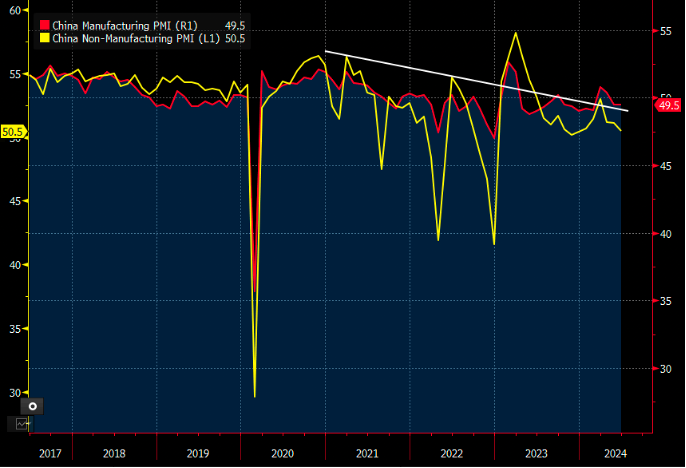
In contrast to the U.S equity, China’s domestic A-share SHSZ300 Index had been treading water again and closing down -3.27% in June. Given that China’s Manufacturing PMI remains in contraction (< 50) while its Services PMI is slipping near to contraction at 50.5, this growth data points to a fact that the macro recovery in China remains bumpy at best.
Chart 2: China ~ lacklustre’s manufacturing & non-manufacturing PMIs
Due to a drag from the China equity as well as negative performance from the rare earth and agricultural business sectors, Airo-BOCA Composite took a hit at -1.17% in June. As we had cut loss on the volatile Cannabis sector, we would expect the performance volatility to improve going forward.
U.S macro growth continued to reverse into contraction as proxied by its ISM Manufacturing PMI that contracted for the third consecutive month. This means the that the manufacturing expansion back in March 2024 seems like a one-off event without a follow-through. Moreover, ISM Services PMI unexpected slipped into contraction for the first time since 2022. A negative growth in the services industry means that the U.S consumers have started to cut their services spending that was supposed to be sticky!
Chart 3: U.S ISM Manufacturing PMI ~ third consecutive month of contraction.
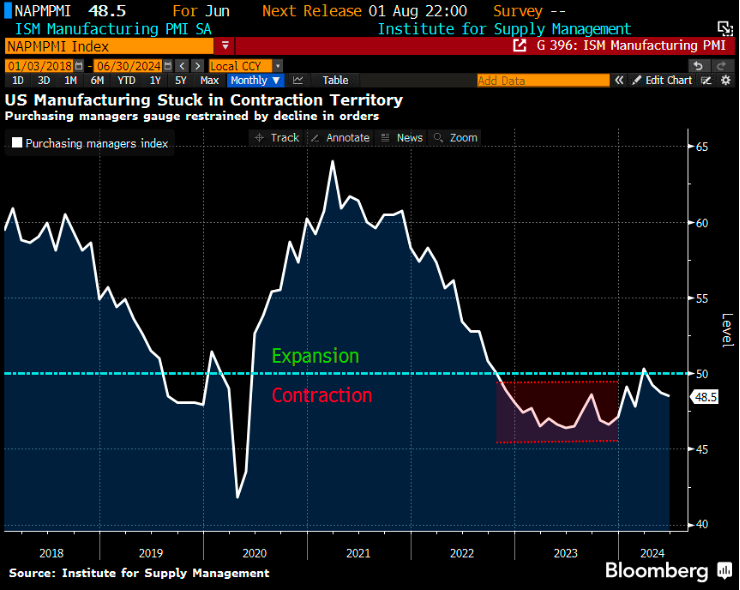
Chart 4: U.S ISM Services PMI ~ slipped into contraction for the first time since 2022!
The big picture is such that the U.S macro growth cycle has come to an end. The disconnection between the U.S equity vs. the reversing macro growth can be attributed to the lagging effect from a macro to micro level. Meaning, corporate earnings’ impact tends to be lagging behind a macro deterioration & only visible later since they are reported only on a quarterly basis.
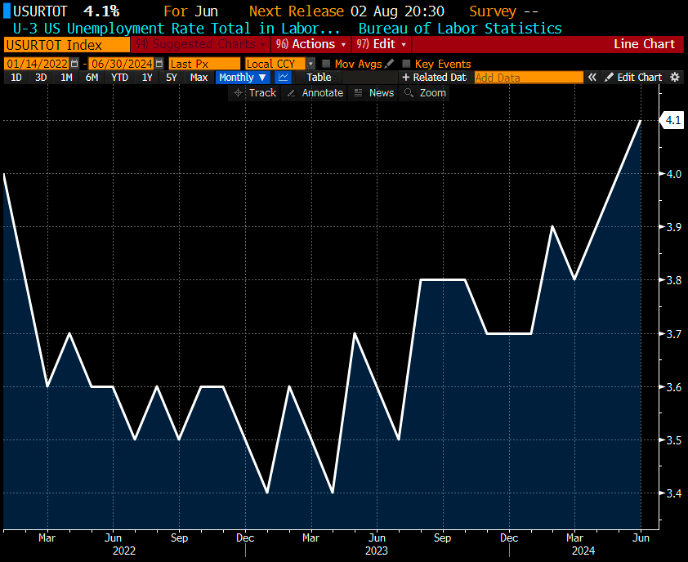
Lastly, the U.S labour market has deteriorated at a fast-paced unseen in the first half of 2024. Specifically, unemployment rate has shoot up to 4.1% in June and it means the U.S Inc had increased the pace of layoff as a result of a slowing economic growth trajectory. In a similar manner, as a result of the negative growth in the goods & services and now the labour market, the earlier disinflation path just started to turn deflationary as the U.S reported a negative month-on-month headline CPI of -0.1% for the first time since 2020. An immediate investment implication of a negative macro growth with a peaking interest rate cycle is positive for the fixed income sector but increasingly risky for the U.S equity sector given where the valuation is.
Chart 5: U.S Unemployment Rate ~ a fast deterioration just started in the labour market
Looking ahead, Airo has a substantial weighting in the fixed income sector and may look to increase further, given the clear peak of the U.S interest rate cycle. On the other hand, we will remain nimble with our overall equity exposure and consider deploying tactical hedging strategies carefully.
July 14th, 2024
William Yii
CIO, CP Global Fintech Solutions
– – –
Disclaimer: Airo is a brand of CP Global Fintech Solutions Sdn Bhd (“CPFS”), licensed by the Securities Commission of Malaysia as a Digital Investment Management company. CPFS is authorised to carry out the business of fund management incorporating innovative technologies into automated discretionary portfolio management services offered to clients under a license issued pursuant to Schedule 2 of the Capital Markets Services Act 2007.
All investing involves risk, including the possible loss of money you invest, and past performance does not guarantee future performance. Historical returns, expected returns, and probability projections are provided for informational and illustrative purposes, and may not reflect actual future performance. CPFS assumes no responsibility for liability for your trading and investment results. It should not be assumed that the methods, techniques, or indicators presented in these products will be profitable, or that they will not result in losses. Past results of any trading system published by CPFS, are not indicative of future returns by that system, and are not indicative of future returns which will be realized by you.