CIO Letter – Mar 2023: 📈 Airo-BOCA +1.08%, outperforming ACWI -3.32% and SPX -2.61% for the month of February

– – –
Highlights:
#1
Airo-BOCA composite closed February 2023 with +1.08%, outperforming both the MSCI All Country World Index (ACWI) and S&P500 Index (SPX) which posted negative returns of -3.32% and -2.61% respectively. As anticipated, the equity market correction began due to a combination of hawkish CPI and PCE data, amid an already negative growth trajectory.
#2
Macro growth data, namely, MNI Chicago PMI & Richmond Fed. Manufacturing PMI plunged further into the contraction zone. Meanwhile, Durable Goods Orders saw a sudden negative growth from the previous month’s positive growth data. These macro hard data highlighted the persistent negative growth environment that the U.S economy is currently in.
#3
In addition to the hard macro data, bond yields have been hawkishly pricing in a terminal rate expectation of 5.62% as of today versus only 4.90% one month ago. This includes almost 3 consecutive +0.25% rate hikes for the incoming FOMC March, May & June meetings respectively. This means a resumption of more interest rate hikes vs. the earlier rate hikes pausing expectation for the coming months.
#4
On China, its recent Caixin China PMIs indicated that the re-opening growth followed-through as expected. However, we have yet to see a similar rebound in the manufacturing activity. Moreover, the recent National People’s Congress (NPC) unveiled a much lower GDP growth target for 2023 that is well below the consensus’ expectation.
#5
Airo maintains our primary stance that the broader downtrend in equity markets remain solidly intact. We shall continue to seek out and capitalize on the current market’s mispricing in order to generate positive alpha for our portfolios.
– – –
Dear Valued Investors,
Airo-BOCA composite closed February 2023 with +1.08%, outperforming both the MSCI All Country World Index (ACWI) and S&P500 Index (SPX), which posted negative returns of -3.32% and -2.61% respectively. In-line with our expectation, the equity market correction started with a hawkish CPI that showed a month-on-month (MoM) strength from -0.1% to +0.5%. More importantly, Fed.’s preferred inflation indicator i.e., PCE Deflator strengthened both MoM and year-on-year from +0.1% to +0.6% and from 5.0% to 5.4% respectively.
Table 1: Airo-BOCA YTD Performance – As of February 2023
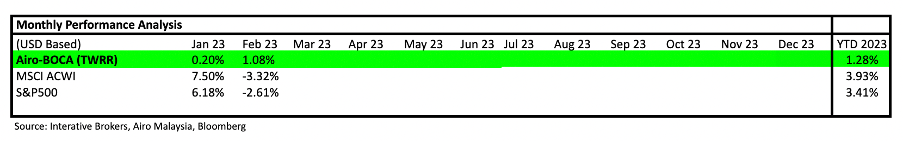
Source: Interactive Brokers, Airo Malaysia, Bloomberg.
At the same time, key macro growth data, namely, MNI Chicago PMI contracted further to 43.6 from 44.3 while Richmond Fed. Manufacturing PMI plunged to -16 from -11. Durable Goods Orders on the other hand saw a sudden negative MoM growth at -4.5% from +5.1% previously. These hard data highlighted the persistent negative growth environment that the U.S economy is currently in.
Chart 1: MNI Chicago PMI contracted further to 43.6 in February from 44.3 in January
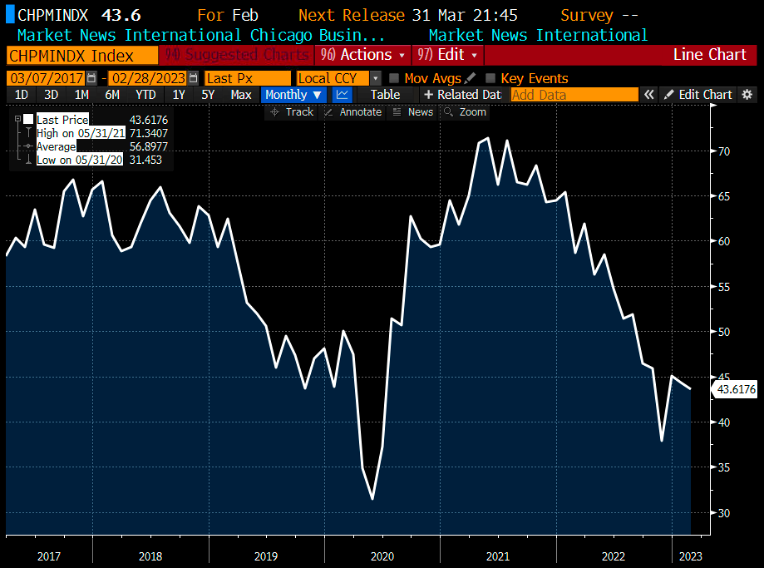
Source: Bloomberg, Airo Malaysia
Chart 2: Richmond Fed. Manufacturing Index plunged to new low at -16 in February from -11 in January
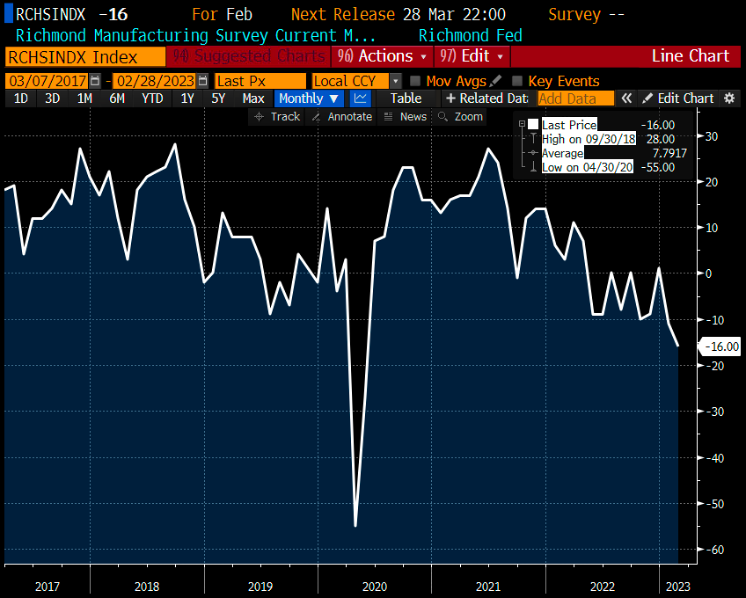
Source: Bloomberg, Airo Malaysia
Chart 3: U.S Durable Goods Orders saw a sudden big contraction in January at -4.5%
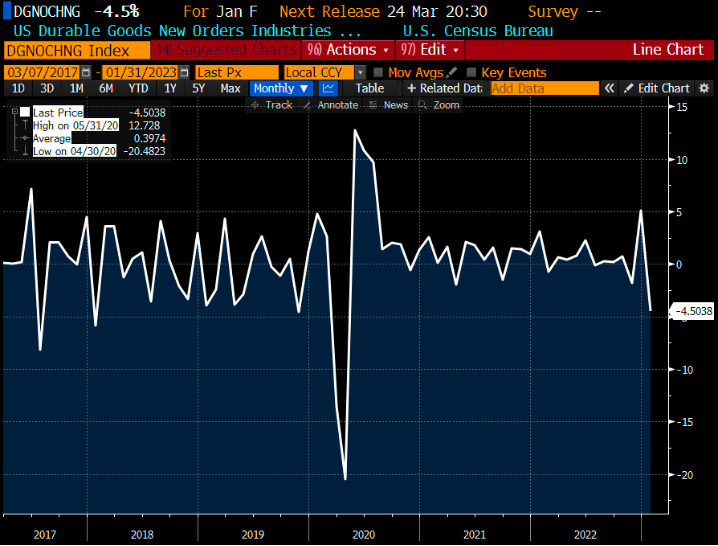
Source: Bloomberg, Airo Malaysia
In addition to the hard macro data, bond yields have been hawkishly pricing in a terminal rate expectation of 5.62% as of today versus only 4.90% one month ago. This means interest rate futures is pricing in almost 3 consecutive of +0.25% rate hikes for the incoming March, May & June FOMC meetings respectively. In fact, the probability of a +0.50% for March’s FOMC meeting is as high as 82% as of today.
Fed. Powell had likewise re-iterated overnight that an increasing pace of interest hikes could be warranted as long as inflations remain elevated. Effectively, this is a resumption bond market expecting more interest rate hikes vs. the earlier rate hikes pausing expectation. While bond prices had reacted lower directly to a higher yield for many weeks, equity markets have yet to price in the higher forward discount rate accordingly. As such, we expect the mis-pricing gap between the higher bond yield vs. the lower equity earnings yield shall be closed in due course.
Table 2: The Probability of 0.50% hike in March’s FOMC is at 81%!
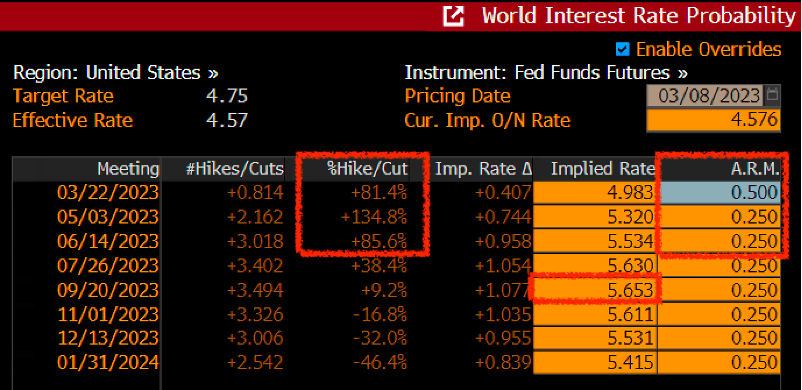
Source: Bloomberg, Airo Malaysia
On China, its recent Caixin China Composite PMI for February expanded to 54.2 from 51.1 in January. The bulk of the growth rebound was understandably coming from the services sector on the resumption of traveling related activity. However, we have yet to see a similar rebound in the manufacturing activity which is an important gauge of the broader economic growth trajectory. On the other hand, in its recent National Party Congress, Chinese Communist Party unveiled a much lower GDP growth target for 2023 that is well below the consensus’ expectation. As such, equity market may attempt to price in a slower macro growth environment in China going forward.
Chart 4: China Real GDP growth target revised lower to 5.0% i.e. lower than both pre & posted Covid era
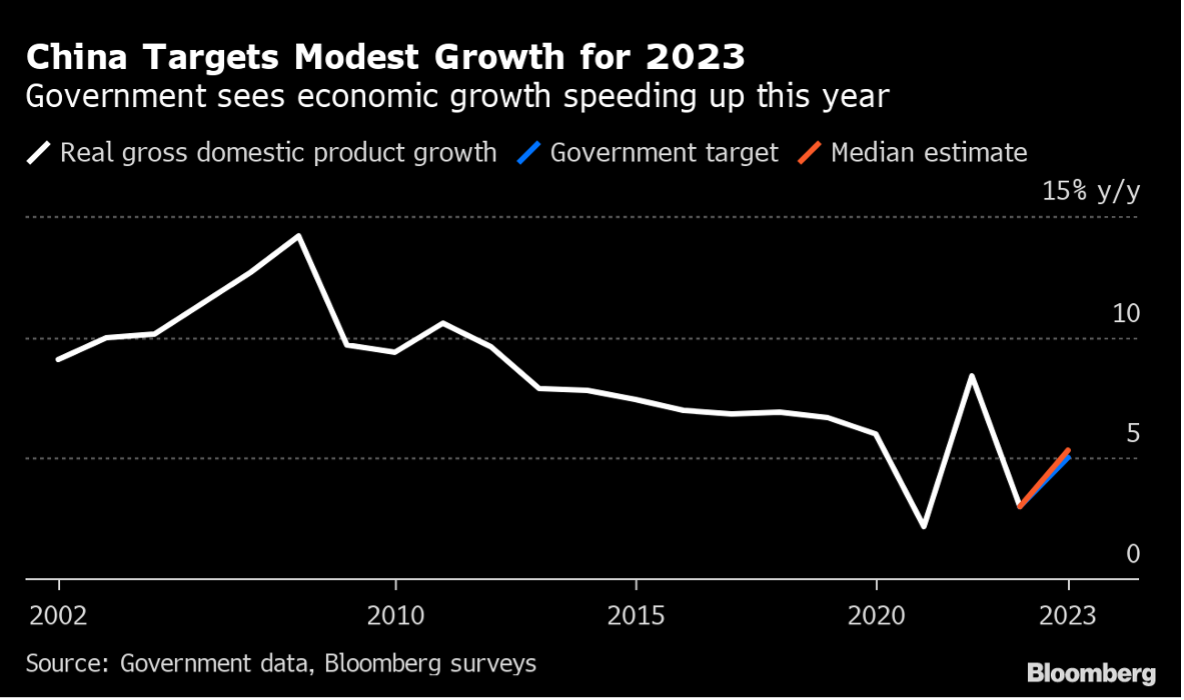
Source: Bloomberg
Table 3: Key Economic Targets for 2023 unveiled during the National Party Congress
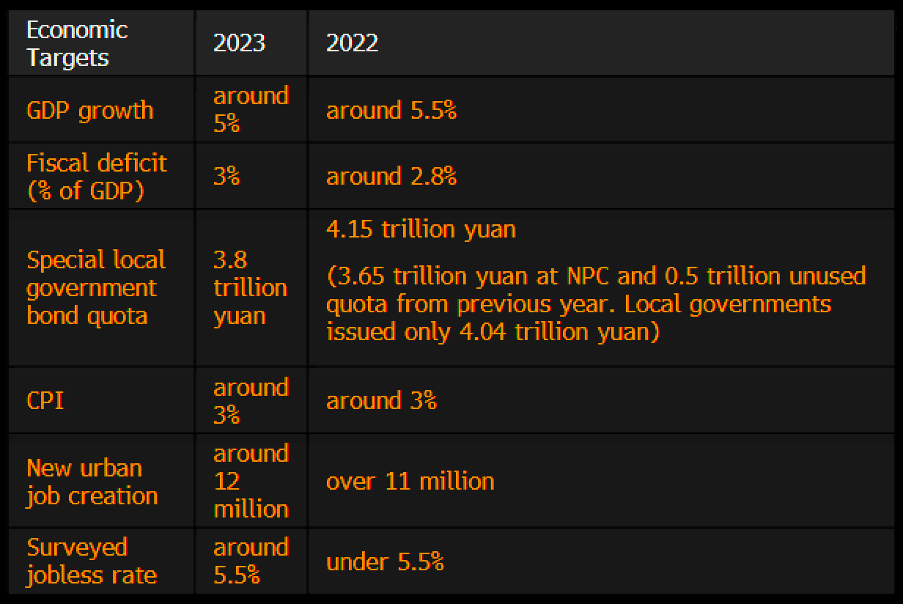
Source: Bloomberg
Airo maintains our primary stance that the broader downtrend in equity markets remain solidly intact. We shall continue to seek out and capitalize on the current market’s mispricing in order to generate positive alpha for our portfolios.
Mar 8th, 2023
William Yii
CIO, Airo Malaysia
– – –
Disclaimer: Airo is a brand of BH Global Fintech Solutions Sdn Bhd (“BHFS”), licensed by the Securities Commission of Malaysia as a Digital Investment Management company. BHFS is authorised to carry out the business of fund management incorporating innovative technologies into automated discretionary portfolio management services offered to clients under a license issued pursuant to Schedule 2 of the Capital Markets Services Act 2007.
All investing involves risk, including the possible loss of money you invest, and past performance does not guarantee future performance. Historical returns, expected returns, and probability projections are provided for informational and illustrative purposes, and may not reflect actual future performance. BHFS assumes no responsibility for liability for your trading and investment results. It should not be assumed that the methods, techniques, or indicators presented in these products will be profitable, or that they will not result in losses. Past results of any trading system published by BHFS, are not indicative of future returns by that system, and are not indicative of future returns which will be realized by you.