
Highlights:
#1
Riding on the positive sentiment in the global equity market, the S&P 500 and ACWI continued their rally and closed the month for July with gains of +2.17% and +1.06% respectively.
#2
The Airo-BOCA Composite declined by -0.90%, primarily due to an existing hedging position. On the other hand, the Airo-Shariah Composite gained +1.75%, driven by sustained exposure to U.S. equity ETFs and technology stocks.
#3
From a valuation perspective, the Nasdaq-100 is trading near the upper end of its P/E band over the past two years, continuing to signal frothy valuations in the technology sector–one of the key drivers of the U.S. equity market rally.
#4
The Global Dow Index continued to show broad-base negative divergence between price and momentum, signaling that a potential correction may be on the horizon.
#5
At the macro level, the impact of U.S. tariffs appears to be delayed, as pass-through effects have yet to show up in consumer prices. Notably, the latest Producer Price Index (PPI) posted a significant jump, suggesting that companies have thus far been absorbing the increased input costs from tariffs.
#6
While the U.S. equity market continues its upward melt-up, we remain cautious given the macro backdrop–particularly the potential delayed impact of U.S. tariffs that has yet to fully materialize.
– – –
Dear Valued Investors,
Riding on the positive sentiment in the global equity market, the S&P 500 and ACWI continued their rally and closed the month for July with gains of +2.17% and +1.06% respectively. In comparison, the Airo-BOCA Composite declined by -0.90%, primarily due to an existing hedging position. On the other hand, the Airo-Shariah Composite gained +1.75%, driven by sustained exposure to U.S. equities and technology stocks.


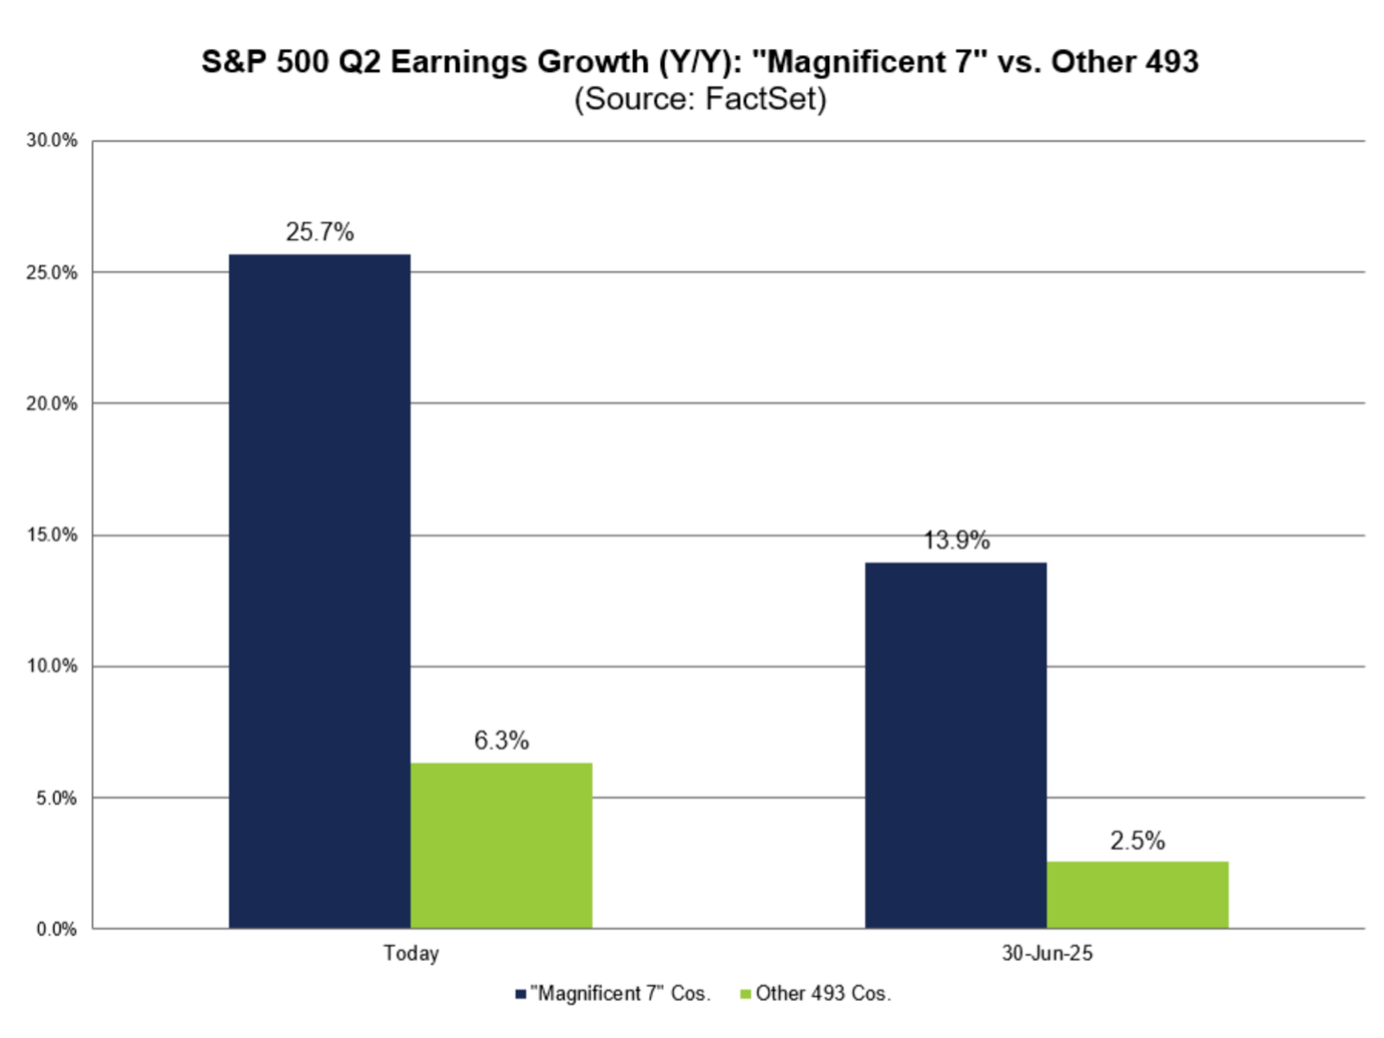
While S&P 500’s Q2 earnings growth remained intact, the gains were mainly concentrated in the ‘Magnificent7’–primarily AI-related stocks. Excluding these, the S&P 500’s EPS growth was limited to low single digits.
Chart 1: Excluding the Magnificent7, S&P 500’s earnings growth would be a low single digit
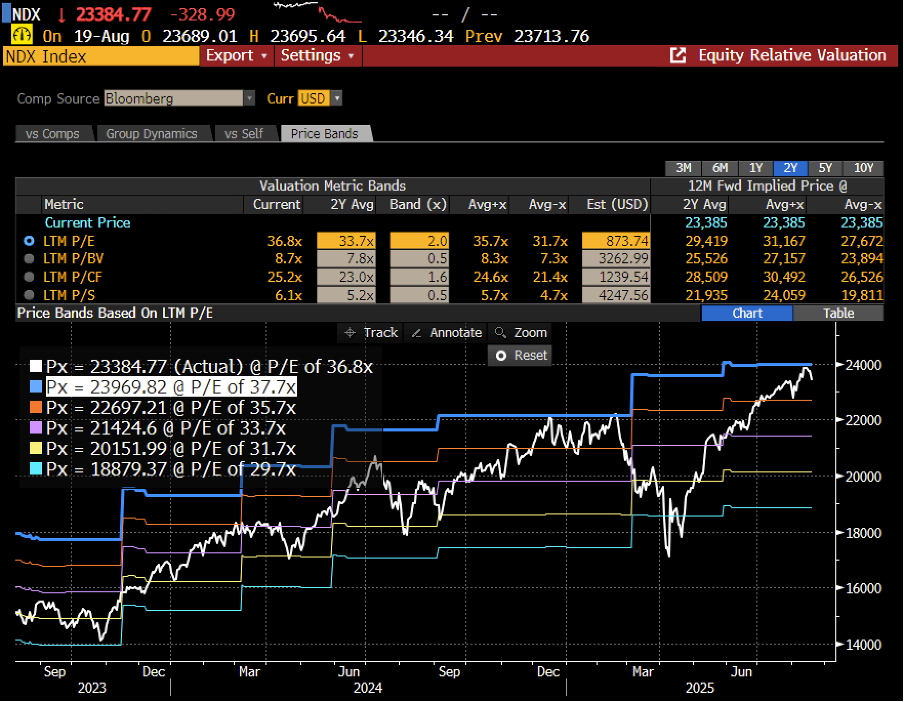
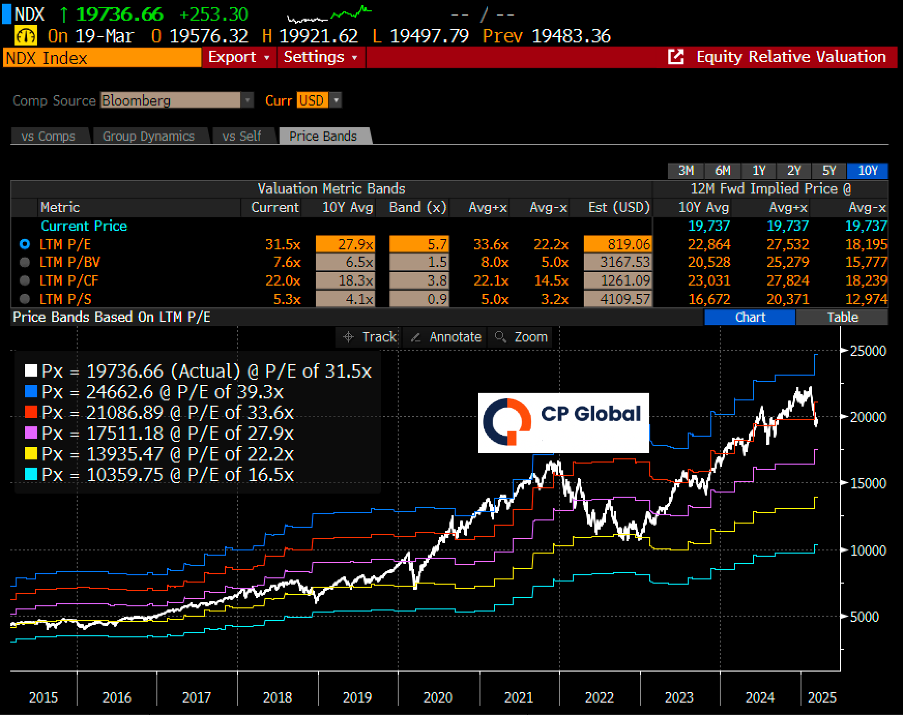
Indeed, from a valuation perspective, the Nasdaq-100 is currently trading near the top end of its P/E band over the past two years–continuing to signal frothy valuations in the technology sector that has fueled the U.S. equity market rally.
Chart 2: Nasdaq100 is trading at its top end of valuation
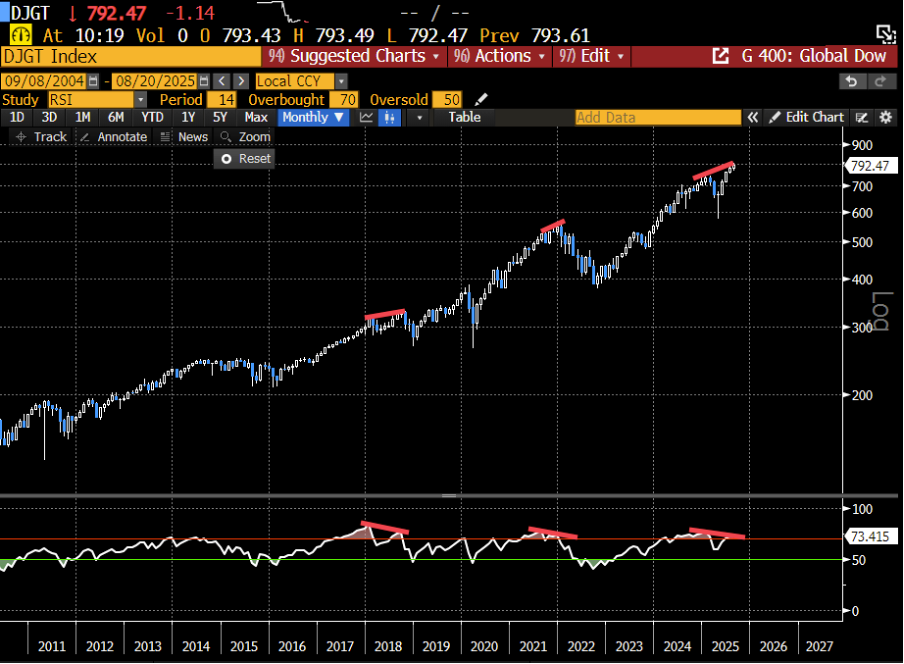
At the same time, the Global Dow Index continued to exhibit a broad-based negative divergence between price and waning momentum–likewise signaling that a potential correction may be incoming.
Chart 3: Global Dow index’s negative momentum divergence remains intact
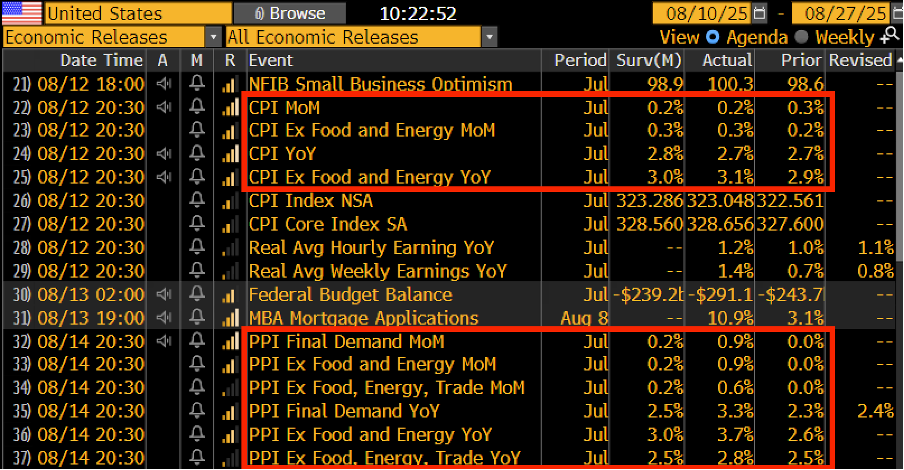
At the macro level, the impact of U.S. tariffs appears to be delayed, as the pass-through to consumer prices has yet to materialize. Notably, the latest Producer Price Index (PPI) recorded a significant jump–supporting the view that companies have been absorbing the increased input costs stemming from tariffs.
Chart 4: PPI saw a big jump that showed companies have been absorbing the tariff input costs
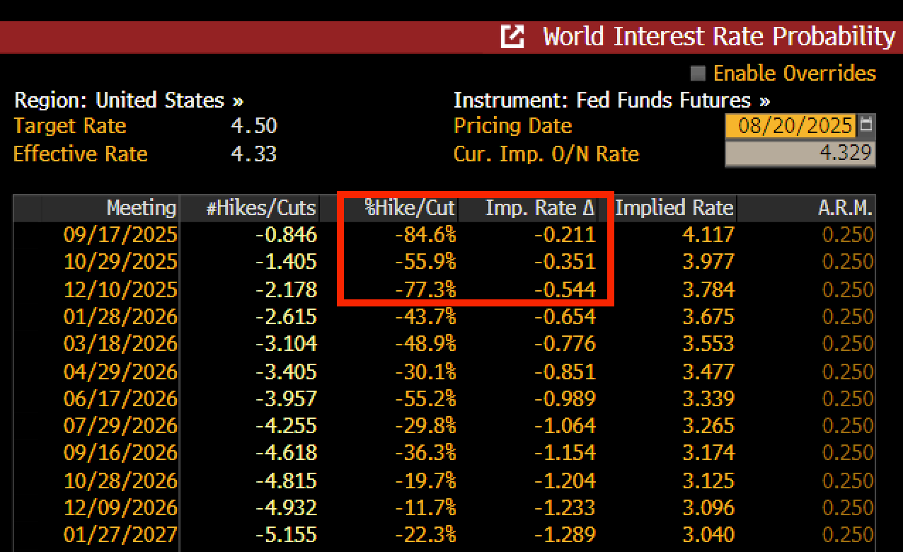
Lastly, the U.S. equity market has likely priced in the upcoming interest rate cut cycle expected to re-start in September 2025. However, given the recent rally, we remain cautious amid the macro backdrop–particularly the delayed impact of U.S tariffs.
Chart 5: Market is pricing-in two interest rate cuts of -0.25% each by the end of 2025
August 20th, 2025
William Yii
CIO, CP Global Fintech Solutions
– – –
Disclaimer: Airo is a brand of CP Global Fintech Solutions Sdn Bhd (“CPFS”), licensed by the Securities Commission of Malaysia as a Digital Investment Management company. CPFS is authorised to carry out the business of fund management incorporating innovative technologies into automated discretionary portfolio management services offered to clients under a license issued pursuant to Schedule 2 of the Capital Markets Services Act 2007.
All investing involves risk, including the possible loss of money you invest, and past performance does not guarantee future performance. Historical returns, expected returns, and probability projections are provided for informational and illustrative purposes, and may not reflect actual future performance. CPFS assumes no responsibility for liability for your trading and investment results. It should not be assumed that the methods, techniques, or indicators presented in these products will be profitable, or that they will not result in losses. Past results of any trading system published by CPFS, are not indicative of future returns by that system, and are not indicative of future returns which will be realised by you.

Highlights:
#1
Despite persistent macro risks associated with Trump’s policy uncertainties, global equities continued bubbling up in June, with the S&P 500 and ACWI posting returns of 4.96% and 4.00%, respectively.
#2
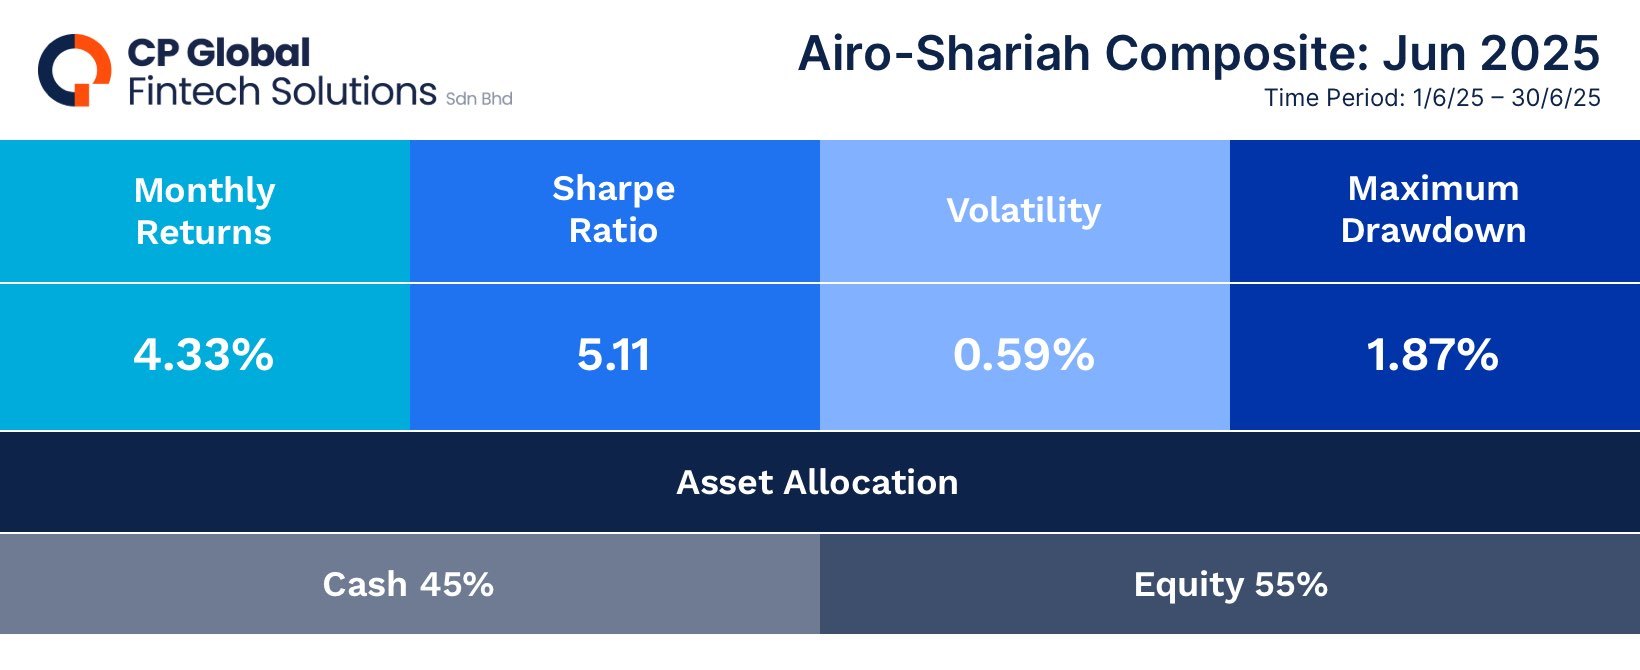
The Airo-BOCA Composite declined by -0.42%, primarily due to an existing hedging position. On the other hand, the Airo-Shariah Composite gained +4.33%, driven by sustained exposure to U.S. equity ETFs and technology stocks.
#3
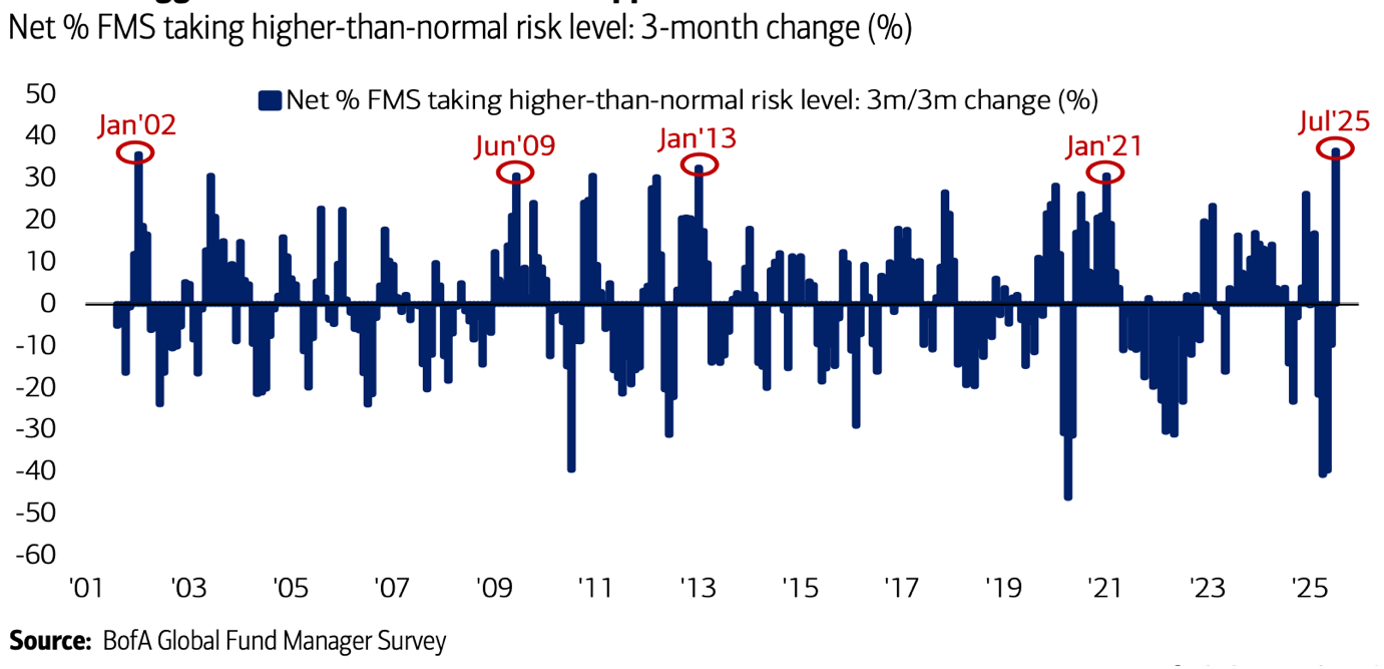
Global fund managers exhibited the highest level of risk-taking since 2002, largely explaining the recent surge in equity chasing.
#4
The Global Dow Index is currently trading near the upper end of its 10-year historical P/E range. Additionally, a broad-base negative divergence in price momentum signals a potential warning.
#5
The A.I. bubble, based on 12-month forward P/E ratios, is now trading at its highest levels since the 1990s.
#6
From a macro perspective, the USD remains at a critical juncture, where the long-term de-dollarisation thesis could spell trouble in the quarters ahead.
– – –
Dear Valued Investors,
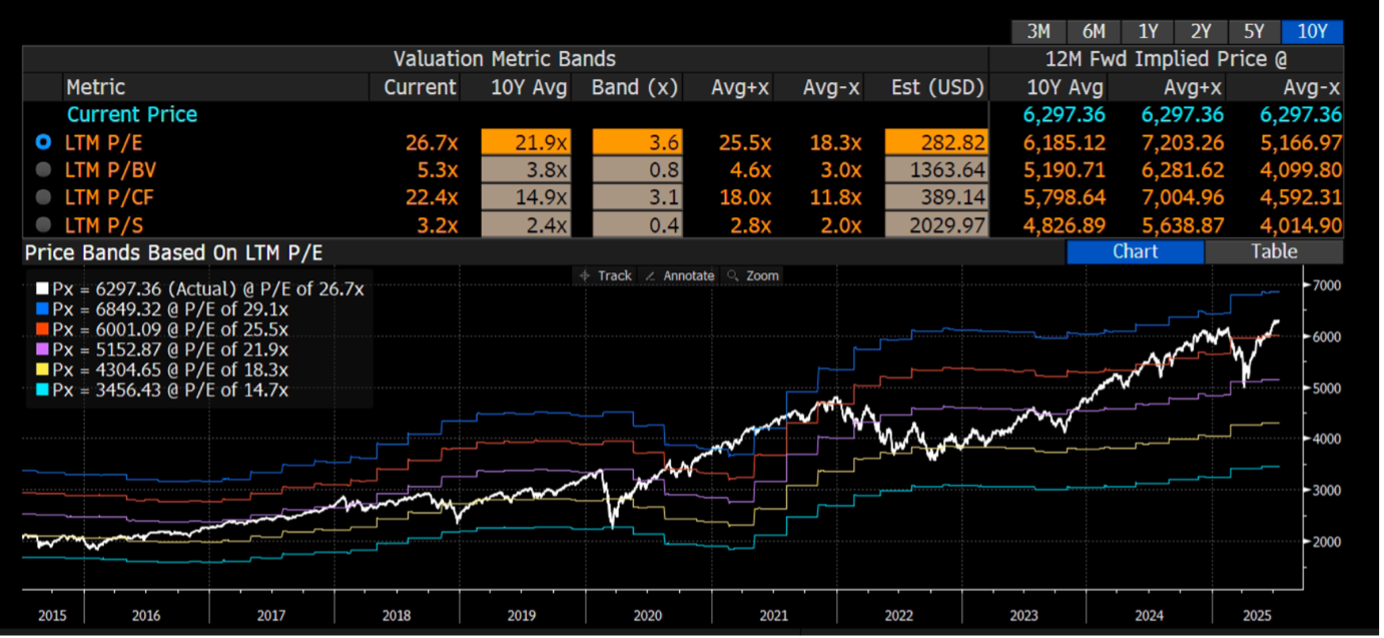
Despite ongoing macro risks associated with Trump’s policy uncertainties, global equities continued bubbling up in June, with the S&P 500 and ACWI returning 4.96% and 4.00%, respectively. Currently, the S&P 500 is trading at approximately 1.8 standard deviations above its 10-year historical average P/E range.
Chart 1: S&P500 is trading at 1.8x above its historical 10-year average PE band.
The Airo-BOCA Composite declined by -0.42%, once again weighed down by an existing hedging position. On the other hand, the Airo-Shariah Composite gained +4.33%, supported by continued exposure to U.S. equity ETFs and technology stocks.
Table 1: Airo-BOCA Composite Performance (June 2025)

Table 2: Airo-Shariah Composite Performance (June 2025)
Global fund managers have exhibited the highest level of risk-taking since 2002, which largely explains the recent exuberance in equity chasing. Despite persistent tariff-related uncertainties, equity markets have largely shrugged off macro risks, driving global indices higher and seemingly pricing-in a blue-sky scenario for forward growth.
Chart 2: Global fund managers’ risk-taking at the highest level since 2002
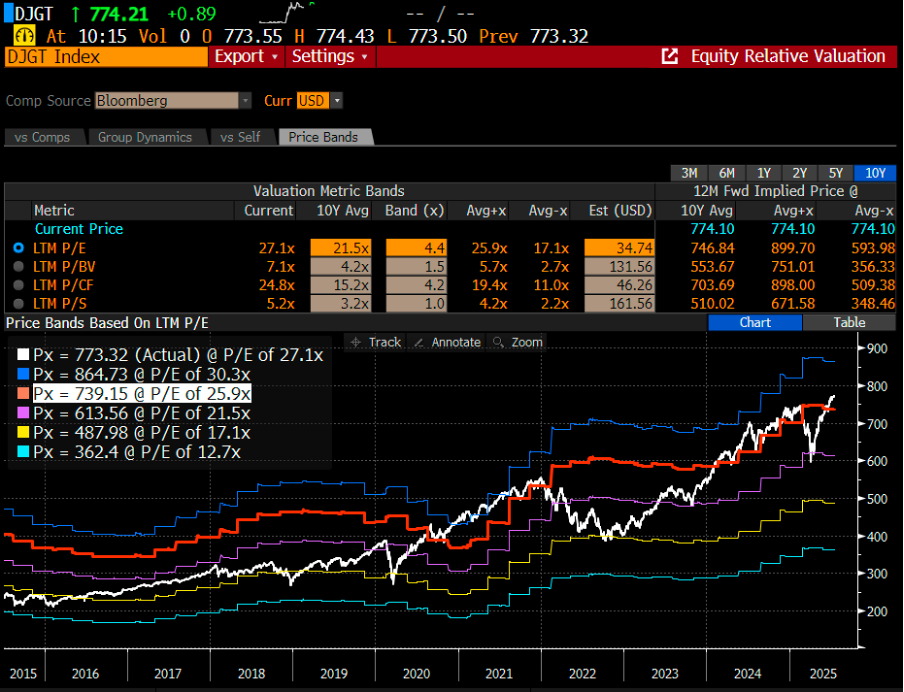
From a global equity valuation standpoint, the Global Dow Index is currently trading near the upper end of its 10-year historical P/E range. This reinforces the view that global equities are advancing in tandem with U.S. equities toward stretched valuation levels.
Chart 3: Global Dow is trading at its upper end of the 10-Year historical PE band
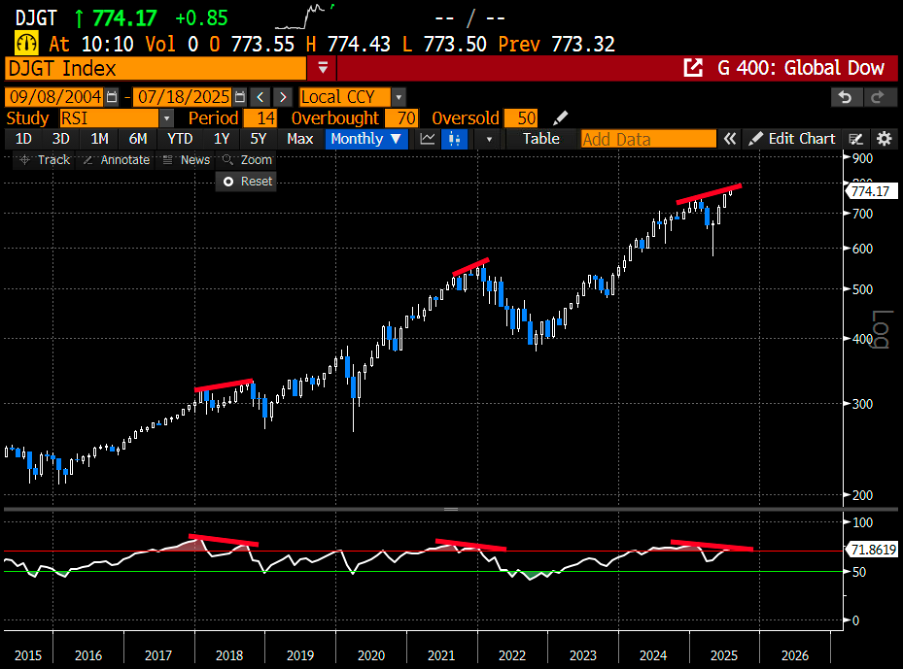
In addition, the Global Dow is exhibiting a broad-base negative divergence–a warning signal from a price momentum perspective. In other words, prices are climbing on weakening momentum, a pattern that often precedes a market correction.
Chart 4: Global Dow’s momentum divergence is sending a warning shot
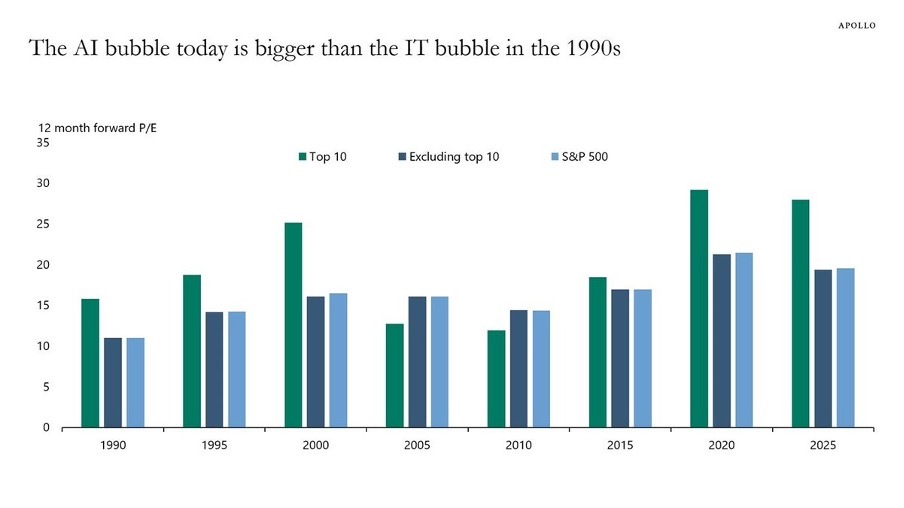
Zooming into the technology sector, the so-called A.I. bubble is trading at historically high levels based on 12-month forward P/E ratios–the highest since the 1990s. Sustaining such elevated valuations would require equally robust forward earnings growth, which has yet to be seen.
Chart 5: A.I bubble is currently surpassing the level during the dot com’s bubble.
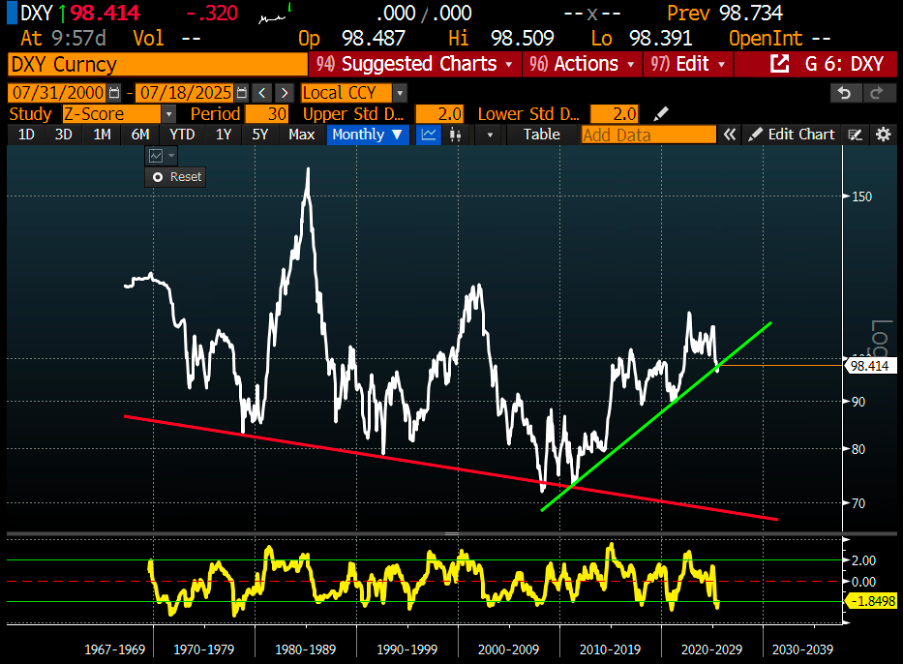
Lastly, the long-term de-dollarisation thesis appears increasingly relevant given the recent trajectory of the USD. While the DXY Index is currently testing its critical uptrend support established since 2010–which thus far remains intact–longer-term structural forces may weigh on the dollar. A shifting global trade rebalancing narrative, coupled with an A.I.-driven deflationary environment, could continue to put downward pressure on the USD. As a result, USD-based assets could be facing an imminent selling pressure in the long-term even if this may not be an apparent risk factor in the current market condition.
Chart 6: USD’s long-term disposition looks bearish despite a near-term rebound
While near-term equity exuberance may persist, Airo continues to maintain a cautious stance at the current juncture.
July 18th, 2025
William Yii
CIO, CP Global Fintech Solutions
– – –
Disclaimer: Airo is a brand of CP Global Fintech Solutions Sdn Bhd (“CPFS”), licensed by the Securities Commission of Malaysia as a Digital Investment Management company. CPFS is authorised to carry out the business of fund management incorporating innovative technologies into automated discretionary portfolio management services offered to clients under a license issued pursuant to Schedule 2 of the Capital Markets Services Act 2007.
All investing involves risk, including the possible loss of money you invest, and past performance does not guarantee future performance. Historical returns, expected returns, and probability projections are provided for informational and illustrative purposes, and may not reflect actual future performance. CPFS assumes no responsibility for liability for your trading and investment results. It should not be assumed that the methods, techniques, or indicators presented in these products will be profitable, or that they will not result in losses. Past results of any trading system published by CPFS, are not indicative of future returns by that system, and are not indicative of future returns which will be realised by you.

Highlights:
#1
U.S equities staged a strong rally in May, with the S&P 500 rising +6.15% and outperforming most of the other markets. In comparison, the MSCI ACWI gained +5.69%, while China’s H-Share Index and A-Share Index returned +3.27% and +2.87% respectively.
#2
Despite the broader market rally, the Airo-BOCA Composite declined by -1.77%, primarily due to an existing hedging position in place. On the other hand, the Airo-Shariah Composite rose by +4.6%, driven mainly by exposure to U.S. equity ETFs and technology stocks.
#3
Following the strong global equity performance in May, markets may be approaching a moment of reckoning amid persistent uncertainty over tariff negotiations, the risk of escalating tensions with Iran, and the ‘big, beautiful fiscal bill’ that is due to be passed in the U.S. Senate.
#4
On the macro front, U.S. growth continued to show signs of slowing, with contractions observed across both soft and hard data indicators, including ISM Manufacturing and Services PMI, Durable Goods Orders, Industrial Production, and Retail Sales.
#5
Airo continues to see a disconnect between equity valuations and the array of macro risks that have yet to fully materialise. As such, we will maintain a nimble and adaptive positioning strategy.
– – –
Dear Valued Investors,
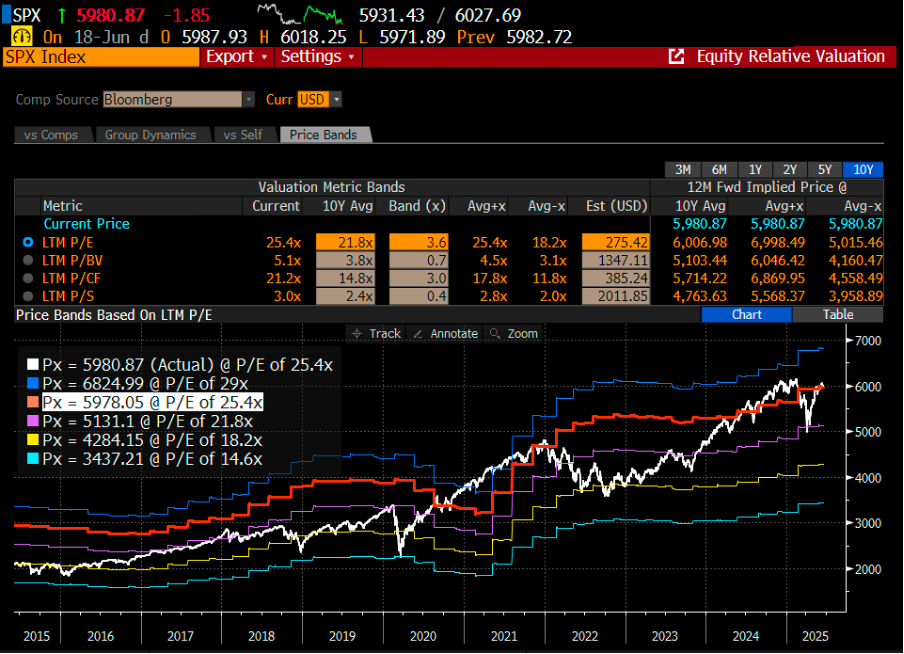
Global equities rallied strongly in May, led by U.S. markets, with the S&P 500 gaining +6.15% and outperforming most of the other markets. In comparison, the MSCI ACWI returned +5.69%, while China’s H-Share Index and A-Share Index returned +3.27% and +2.87%, respectively. The rally was largely driven by an interim de-escalation in trade tensions between the U.S. and China, as both sides moved to ease certain export restrictions.
Chart 1: S&P500 is trading at +1x-sigma above its 10Y historical PE bands
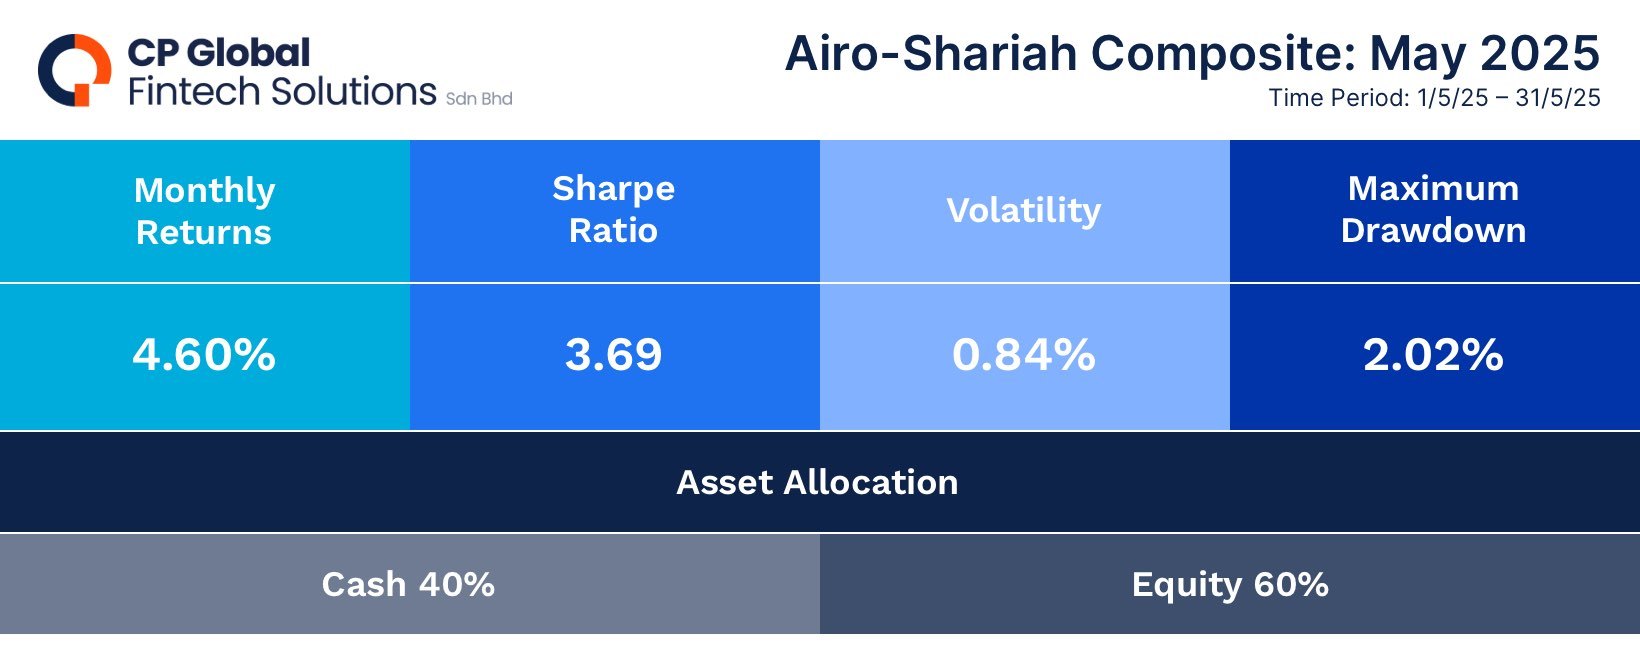
Due to an existing hedging position against technology stocks, the Airo-BOCA Composite declined by -1.77% despite the broader market rally. On the other hand, the Airo-Shariah Composite gained +4.6%, largely supported by exposure to U.S. equity ETFs and technology stocks.
Table 1: Airo-BOCA Composite Performance (May 2025)
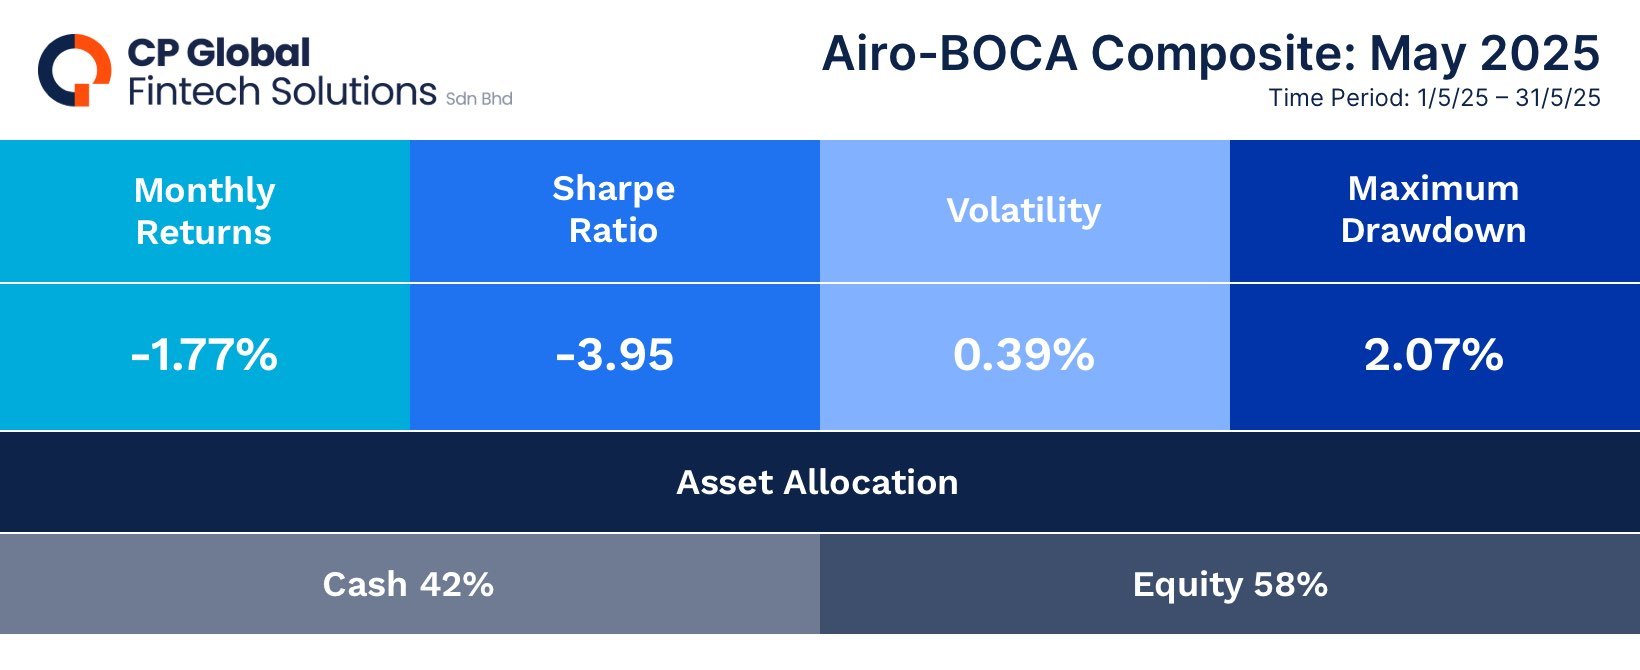
Table 2: Airo-Shariah Composite Performance (May 2025)
Following the stellar global equity performance in May, markets may be approaching a moment of reckoning amid ongoing uncertainty surrounding: (i) tariff negotiations, (ii) a potential Iran war escalation, and (iii) the ‘big, beautiful fiscal bill’ that is due to be passed in the U.S. Senate.
The interim tariff de-escalation between the U.S. and China was intended to pave the way for further negotiations aimed at reaching an eventual trade agreement between the two nations. Meantime, the global market is also closely watching the U.S. as it seeks to finalise trade deals with other countries before the 90-day tariff pause expires on July 9.
Trump recently signaled that a decision on whether the U.S. will directly engage in the conflict with Iran could be made within the next two weeks. This escalating geopolitical risk looms large and is expected to fuel increased volatility across asset classes in the near term.
The ‘big, beautiful fiscal bill’ is set to be passed by the U.S. Senate by July 4. In our view, U.S. equities have largely priced-in the optimism surrounding its potential approval. As such, any deviation from this expectation could trigger a wave of profit-taking and act as a near-term selling catalyst for the U.S. equity market. Additionally, if the bill is passed, it may unsettle the bond market due to concerns over rising budget deficits in the years ahead.
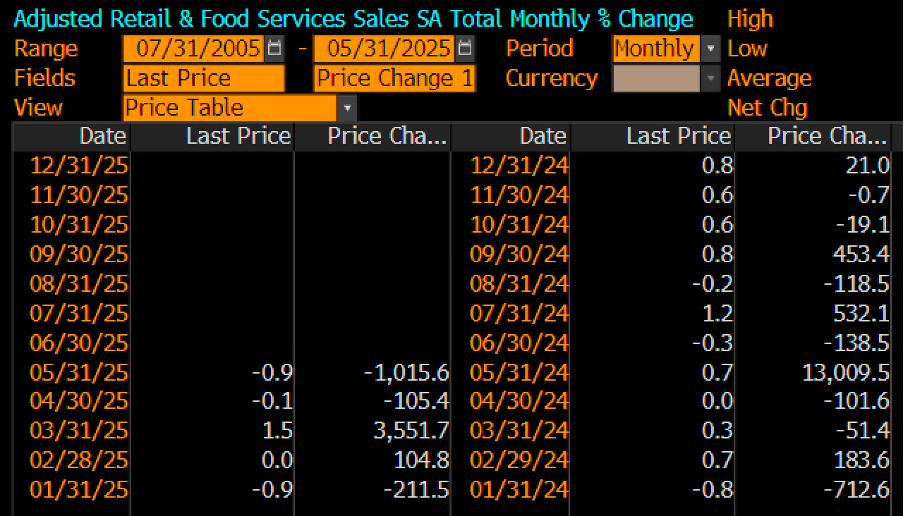
On the macro front, U.S. growth data continue to show signs of slowing, with contractions seen across both soft and hard data indicators. ISM Manufacturing has remained in contractionary territory for three consecutive months since March, while ISM Services PMI slipped into contraction for the first time in May. Durable goods orders plunged -6.3% month-on-month (MoM) in April, partly driven by heightened tariff rhetoric from Trump. Industrial production also cooled, recording just +0.60% year-on-year (YoY) growth. Meanwhile, retail sales declined again in May, falling -0.9% MoM.
Chart 2: ISM Manufacturing PMI contracted for the third consecutive month
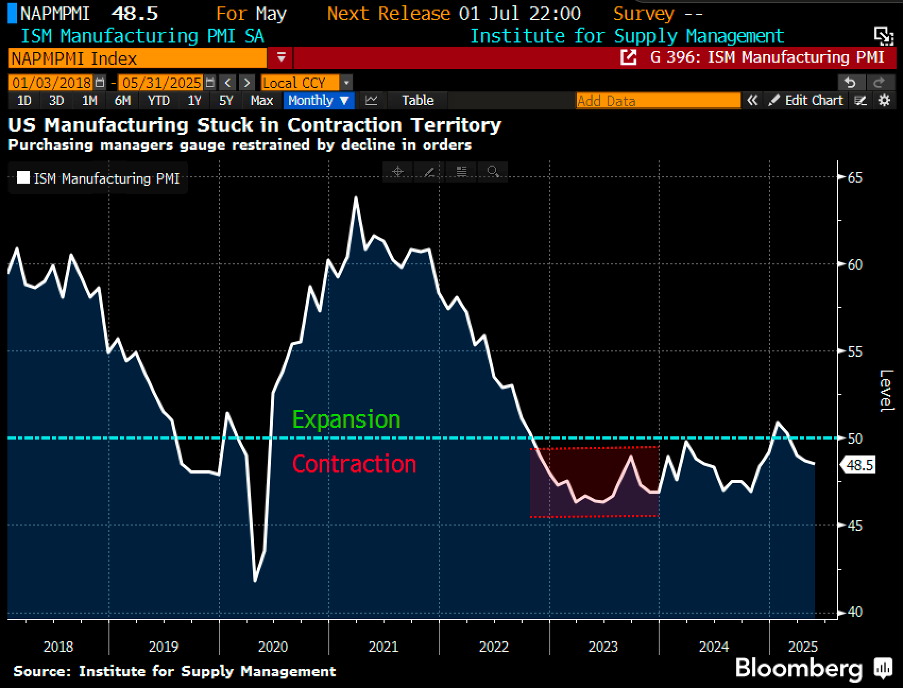
Chart 3: ISM Services PMI just slipped into a contraction in May
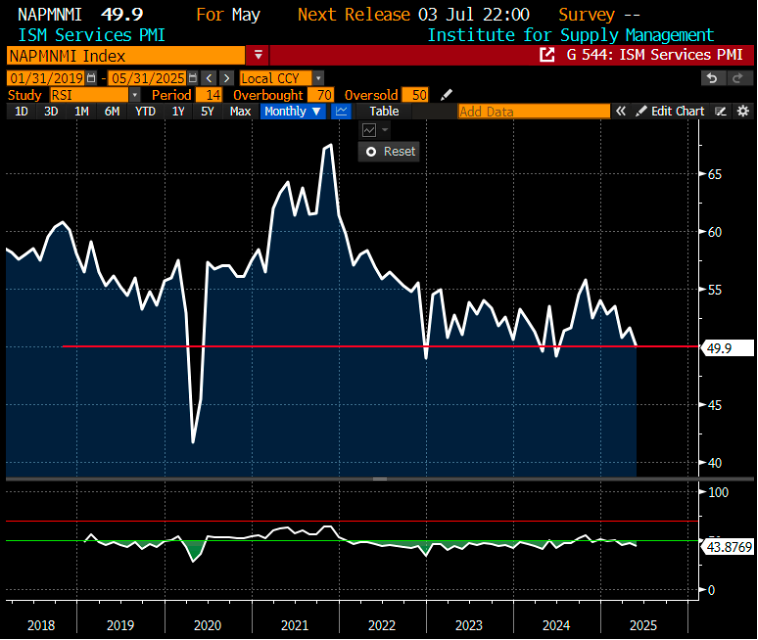
Chart 4: Durable goods orders saw a big plunge in April at -6.3% MoM
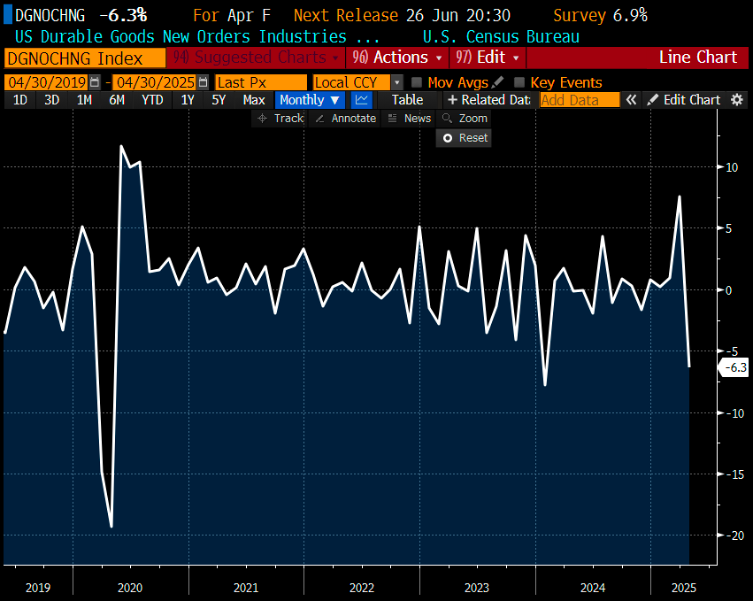
Chart 5: Car sales’ drop is a big contributor in the durable goods orders
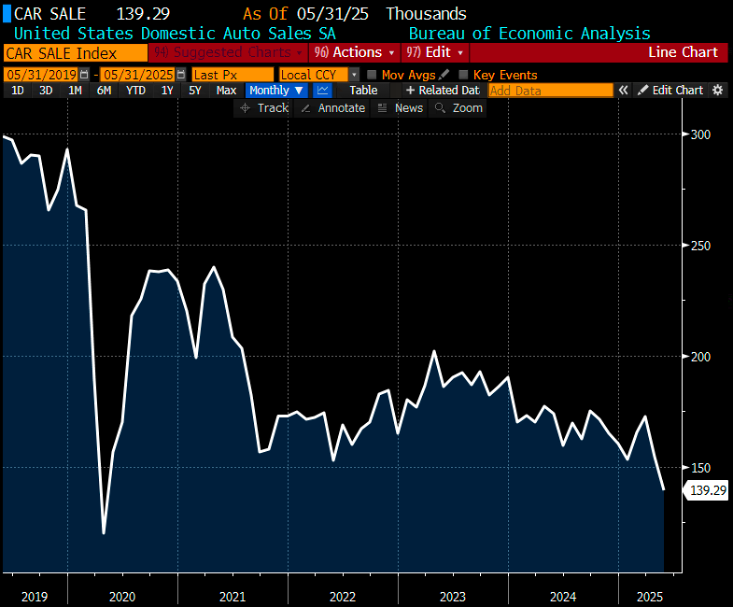
Chart 6: Industrial production growth turned cooler at only +0.6% YoY
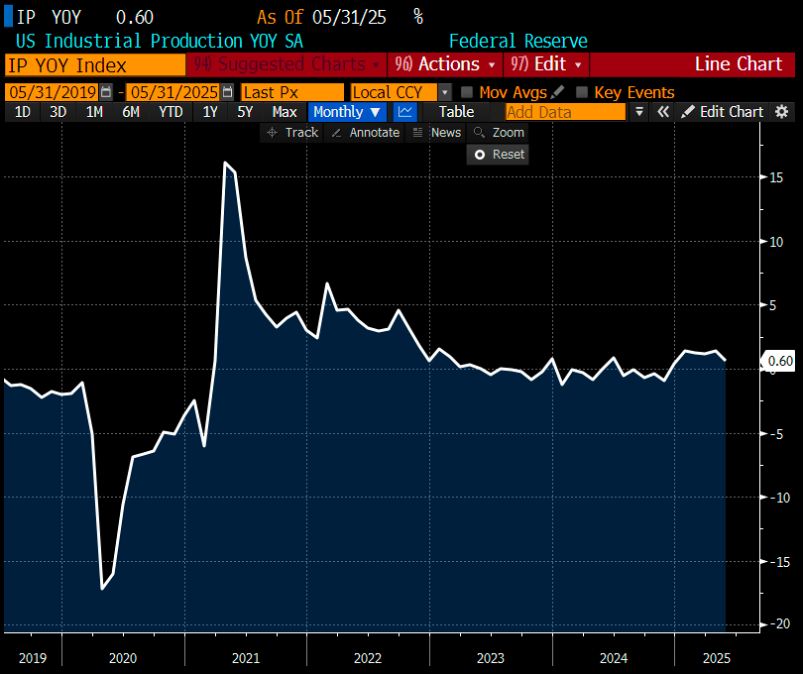
Chart 7: Retail sales saw a second consecutive month of contraction at -0.9% MoM
Airo continues to see a disconnect between equity valuations and the array of macro risks that have yet to fully materialise. As such, we will maintain a nimble and adaptive positioning strategy.
June 20th, 2025
William Yii
CIO, CP Global Fintech Solutions.
– – –
Disclaimer: Airo is a brand of CP Global Fintech Solutions Sdn Bhd (“CPFS”), licensed by the Securities Commission of Malaysia as a Digital Investment Management company. CPFS is authorised to carry out the business of fund management incorporating innovative technologies into automated discretionary portfolio management services offered to clients under a license issued pursuant to Schedule 2 of the Capital Markets Services Act 2007.
All investing involves risk, including the possible loss of money you invest, and past performance does not guarantee future performance. Historical returns, expected returns, and probability projections are provided for informational and illustrative purposes, and may not reflect actual future performance. CPFS assumes no responsibility for liability for your trading and investment results. It should not be assumed that the methods, techniques, or indicators presented in these products will be profitable, or that they will not result in losses. Past results of any trading system published by CPFS, are not indicative of future returns by that system, and are not indicative of future returns which will be realised by you.

Highlights:
#1
April’s sharp correction was swiftly followed by a striking rebound, with U.S. equities seemingly brushing off Trump’s tariff rhetoric as if nothing happened! As a result, the S&P 500 ended the month with only a modest decline of -0.76%, while the MSCI ACWI posted a gain of +0.52%.
#2
In comparison, the Airo-BOCA Composite declined by -2.7%, weighed down primarily by its hedging positions. The Airo-Shariah Composite also fell by -1.84%, driven largely by weakness in consumer and pharmaceutical stocks.
#3
The pressing question remains: what has fundamentally changed over the past month? The short answer–not much. Although the U.S. and China have resumed dialogue, the current de-escalated tariff rate on Chinese goods still stands at 30%, which is expected to weigh on U.S. GDP growth in the near term.
#4
From China’s perspective, exports to the U.S. amount to approximately $0.5 trillion. To put this into context, China is responsible for manufacturing one-third of global goods, while U.S. households consume about one-third of global output. In other words, the livelihood of millions of Chinese factory workers is directly tied to this trade relationship.
#5
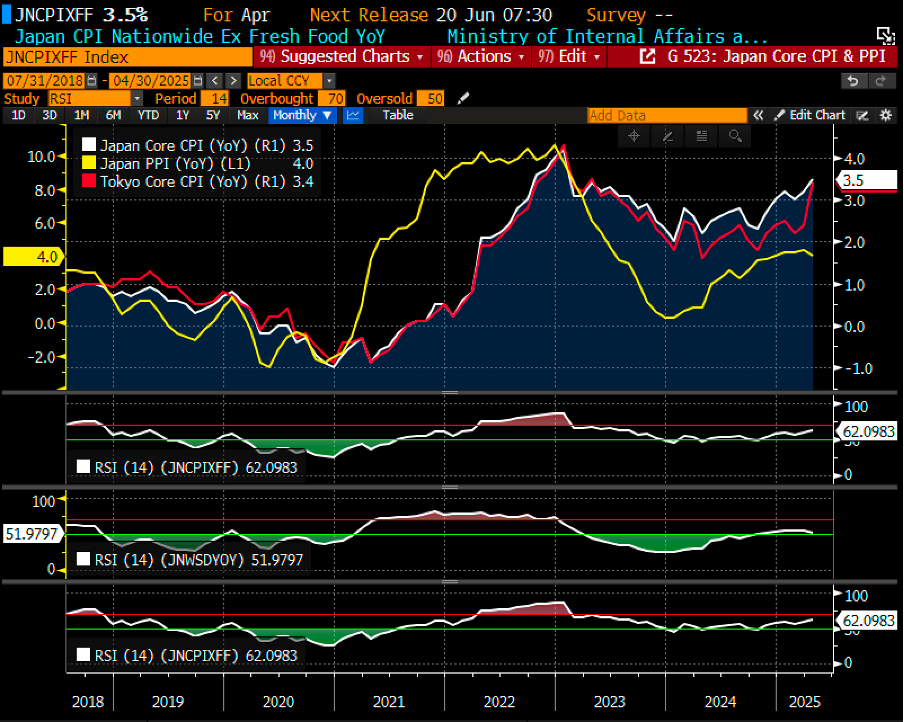
Japan continues to grapple with persistent inflationary pressures, as core inflation stays firmly above 3.0% year-on-year. This has placed mounting pressure on the Bank of Japan (BOJ), particularly in light of its decision to leave interest rates unchanged at the May policy meeting.
– – –
Dear Valued Investors,
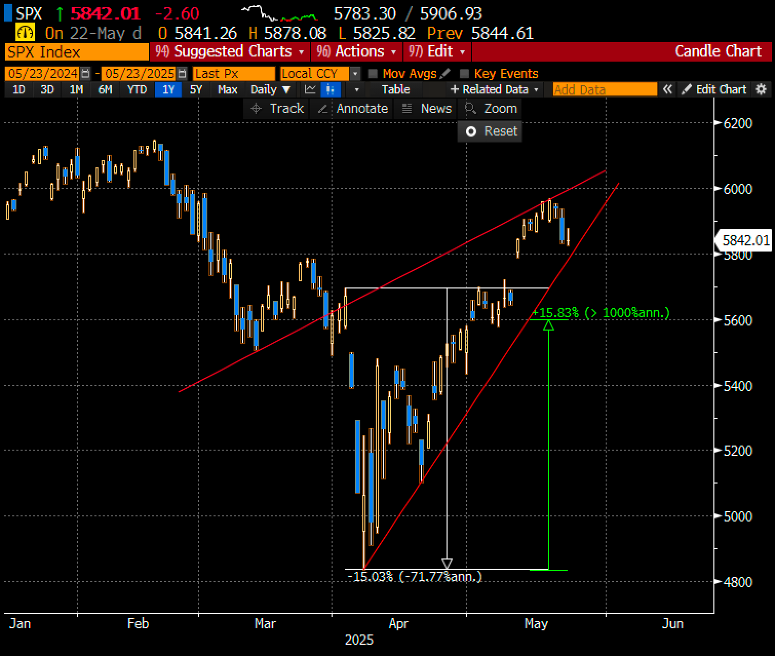
The sharp correction in April was followed by an equally dramatic rebound, as U.S. equities appeared to shrug off Trump’s tariff rhetoric entirely. Despite an initial drawdown of around -15% following Trump’s ‘Liberation Day’ announcement, the S&P 500 managed to rally +16% from its April low, ultimately ending the month with a modest decline of just -0.76%. April 2025 will be remembered as one of the most volatile months in global equity market history.
Chart 1: S&P500 whipsaw +15% in both direction and closed down -0.75% in April 2025
In comparison, the Airo-BOCA Composite was down -2.7% as it was negatively impacted by the hedging positions. Meanwhile, the Airo-Shariah Composite also declined by -1.84% largely attributed to underperformance in consumer and pharmaceutical stocks.
Table 1: Airo-BOCA Composite Performance (April 2025)

Table 2: Airo-Shariah Composite Performance (April 2025)

The pressing question is: what has fundamentally changed over the past month? The short answer–not much. Although the U.S. and China have resumed dialogue, the de-escalated tariff on Chinese goods remains at 30%. Since tariffs on Chinese imports effectively act as a tax on U.S. consumers, this is expected to weigh on U.S. GDP growth in the near term.
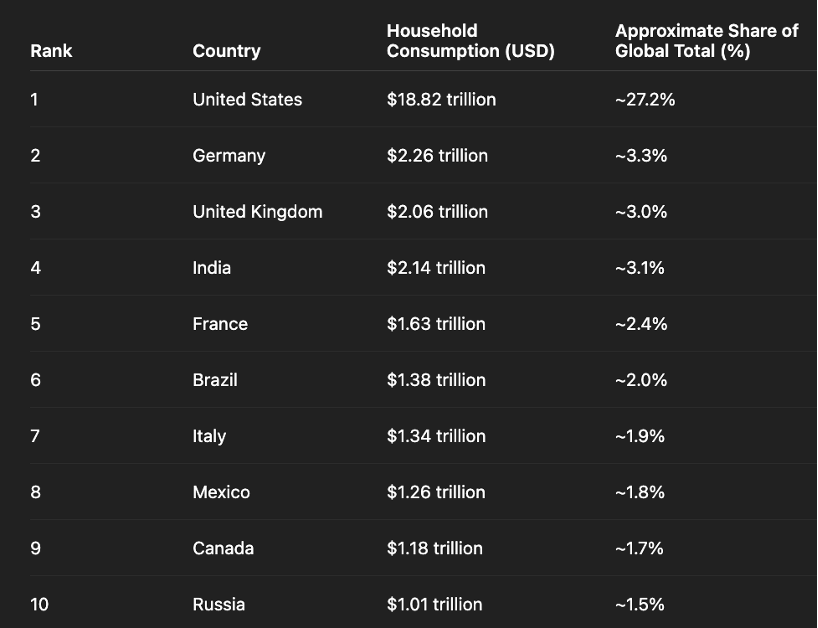
From China’s perspective, exports to the U.S. total approximately $0.5 trillion. For context, China manufactures one-third of global goods, while U.S. households consume about one-third of global output. This interdependence underscores the stakes: the livelihoods of China’s 120 million factory workers–out of a total labor force of 740 million–are closely tied to the strength of this trade relationship.
Table 3: China manufactures 1/3 of total global output
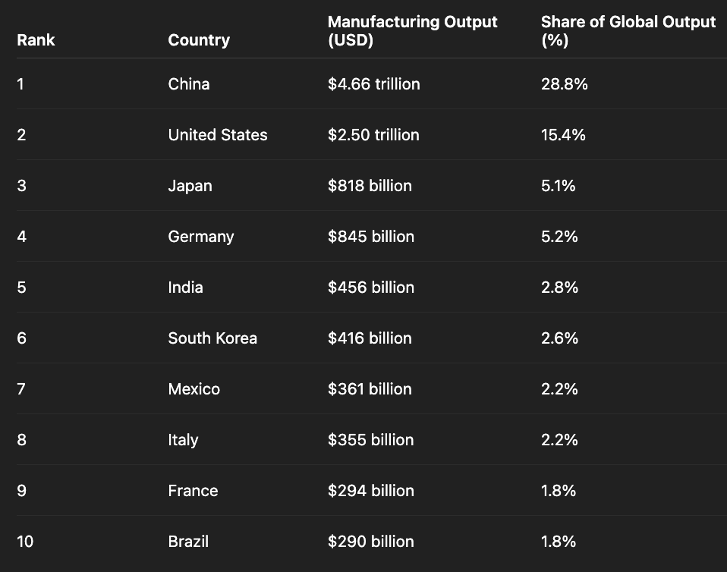
Table 4: U.S household consumes 1/3 of total global consumption
Japan continues to face persistent inflationary pressure, with core inflation remaining firmly above 3.0% year-on-year. As a result, the Bank of Japan (BOJ) is under mounting pressure, particularly following its decision to hold rates steady at the May policy meeting. Assuming inflation shows no signs of easing in the coming months, we expect the BOJ to resume its path of interest rate hikes.
Chart 2: Japan’s Core CPI is at 3.5% as of April 2025, i.e. 150 basis points above the 2% target!
May 23rd, 2025
William Yii
CIO, CP Global Fintech Solutions.
– – –
Disclaimer: Airo is a brand of CP Global Fintech Solutions Sdn Bhd (“CPFS”), licensed by the Securities Commission of Malaysia as a Digital Investment Management company. CPFS is authorised to carry out the business of fund management incorporating innovative technologies into automated discretionary portfolio management services offered to clients under a license issued pursuant to Schedule 2 of the Capital Markets Services Act 2007.
All investing involves risk, including the possible loss of money you invest, and past performance does not guarantee future performance. Historical returns, expected returns, and probability projections are provided for informational and illustrative purposes, and may not reflect actual future performance. CPFS assumes no responsibility for liability for your trading and investment results. It should not be assumed that the methods, techniques, or indicators presented in these products will be profitable, or that they will not result in losses. Past results of any trading system published by CPFS, are not indicative of future returns by that system, and are not indicative of future returns which will be realized by you.

Highlights:
#1
Amid renewed concerns over U.S. tariff policy, global financial markets experienced another round of selloffs in March, with the S&P 500 and MSCI ACWI Index declining by -5.75% and -3.67%, respectively. In contrast, China attracted notable rotational inflows, driving the HSCEI Index up by +1.14% over the month.
#2
In comparison, the Airo-BOCA Composite outperformed both the S&P 500 and MSCI ACWI, delivering a resilient positive return at +0.75% in March. This absolute and relative outperformance was largely driven by gains in long positions in copper, gold, and gold miners. Meanwhile, the Airo-Shariah Composite posted a return of -3.96%, yet still managed to outperform the S&P 500.
#3
Tariff negotiations between the U.S. and its trading partners continue to progress at a sluggish pace. While recent market corrections have partially priced in the uncertainty surrounding U.S. tariffs, we remain cautious. Financial markets are inherently averse to uncertainty and are unlikely to respond positively until there is greater clarity and tangible progress in negotiations–a process that will take time to materialize.
#4
Persistent inflationary pressures and signs of a macroeconomic recover in Japan have been key drivers behind the Yen’s recent strength. Year-to-date, the JPY has appreciated approximately +11% against the USD. Despite strong economic data and a firmer currency, the interest rate market is not pricing in a rate hike at the upcoming Bank of Japan meeting on May 1st–highlighting a potential disconnect between underlying fundamentals and market expectations.
#5
The U.S. corporate earnings season for Q1 2025 has begun, with banks reporting stronger results, driven by elevated trading revenues amid heightened market volatility. As usual, the technology sector will be in the spotlight, with investors closely watching capital expenditure plans as a key indicator of future growth prospects.
– – –
Dear Valued Investors,
Driven by renewed concerns over U.S. tariffs, global financial markets experienced another wave of selloffs in March, with the S&P 500 and MSCI ACWI Index declining by -5.75% and -3.67%, respectively. In contrast, there were some notable rotational flows into China, where the HSCEI Index posted a gain of +1.14% for the month.
Following the recent market correction, the S&P 500 is now trading at its average price-to-earnings (P/E) valuation within its 10-year historical range. In other words, U.S. equities appear neither overvalued nor undervalued at current levels. However, based on historical precedent, further downside remains possible, particularly if there is no meaningful improvement in macroeconomic or corporate fundamentals in the near term.
Chart 1: After the recent severe correction, S&P500 is trading at the average PE of its 10-year PE bands.
In comparison, the Airo-BOCA Composite outperformed both the S&P 500 and MSCI ACWI, delivering a resilient positive return of +0.75% in March. The absolute and relative outperformance was primarily driven by gains in long positions in copper, gold, and gold miners. Meanwhile, the Airo-Shariah Composite, posted a return of -3.96%, yet still outperformed the S&P 500 over the same period.


Tariff negotiations between the U.S. and other trading partners continue to progress at a slow pace. While recent market corrections have partially priced in the uncertainty surrounding U.S. tariff policies, we remain cautious. Financial markets are inherently sensitive to uncertainty and are unlikely to respond positively until there is greater clarity and concrete progress in negotiations–something that may take time to materialize.
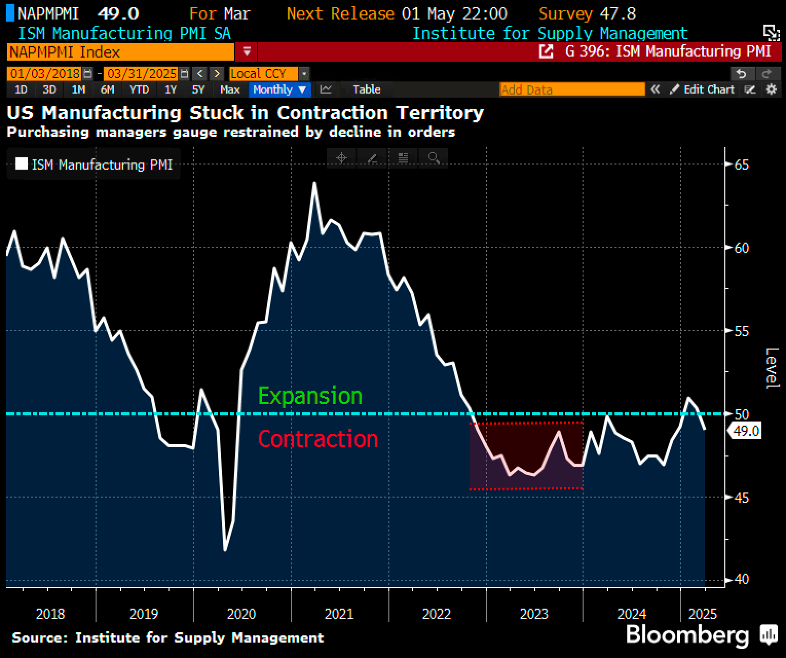
From a macroeconomic perspective, the U.S. Manufacturing PMI has slipped back into contraction after a brief return to expansion in recent months. This signals a potential further deterioration in forward-looking manufacturing activity, especially as tariff implementations begin to take effect in the coming months–assuming no meaningful resolution is reached.
Chart 2: ISM Manufacturing PMI slipped into contraction again
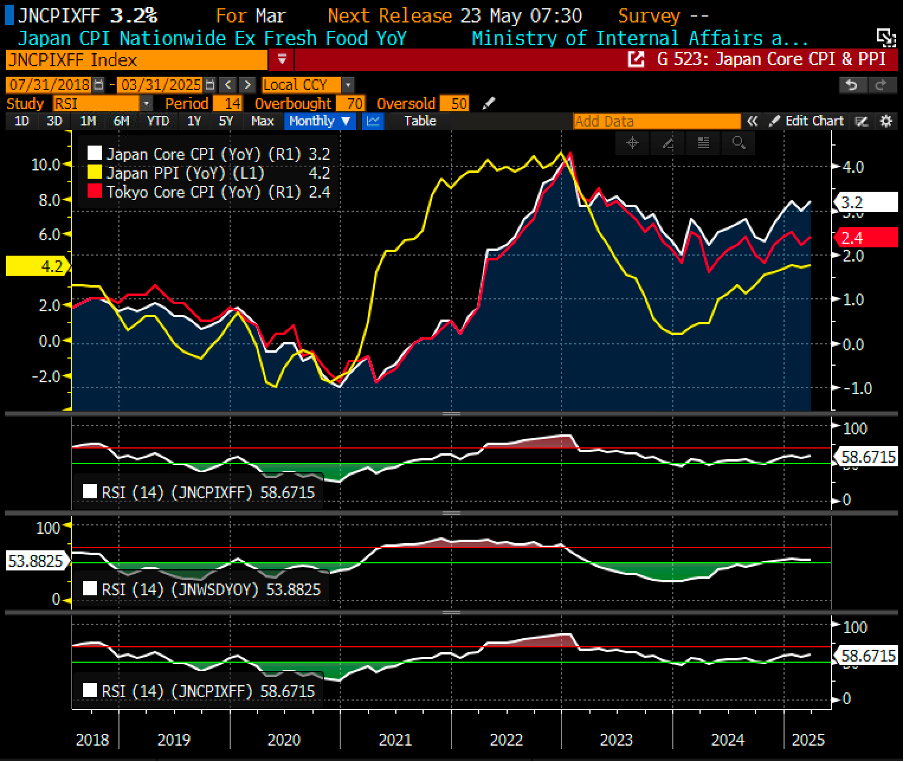
The persistent inflationary pressures in Japan, coupled with a recovering macroeconomic outlook, have been the key drivers of the strengthening Yen. Year-to-date, the JPY has appreciated by approximately +11% against the USD. Despite the strong inflation, growth data, and currency movement, however, the interest rate market does not anticipate a rate hike at the upcoming Bank of Japan (BOJ) decision on May 1st. This creates a potential misalignment between fundamental factors and market expectations, suggesting a risk of a selloff in Yen carry trades if the BOJ were to unexpectedly hike the interest rate in May.
Chart 3: Japan, Tokyo Core CPI & PPI are getting hotter in March 2025
On the micro front, the U.S. corporate earnings season for Q1 2025 has begun, with banks reporting stronger earnings driven by heightened trading revenues and volatile financial markets. However, the technology sector will once again be the main focus. Market participants are expected to closely monitor the capital expenditure plans of tech companies, as these may offer valuable insights into their future growth prospects.
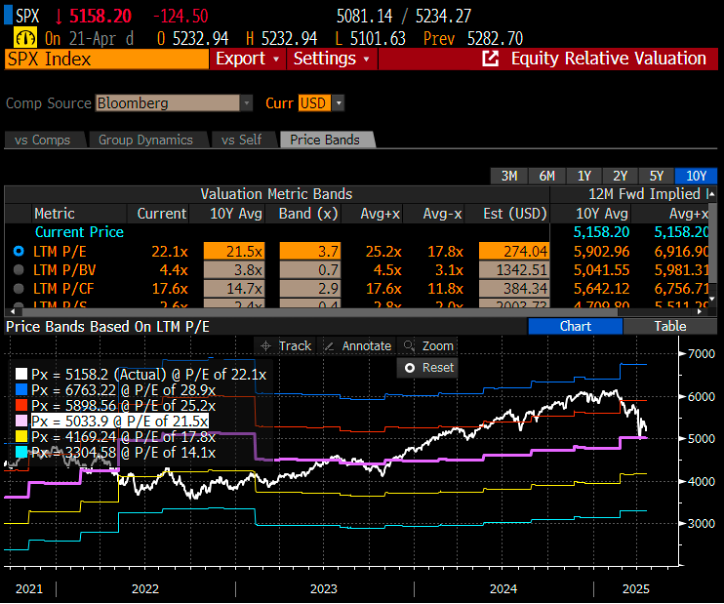
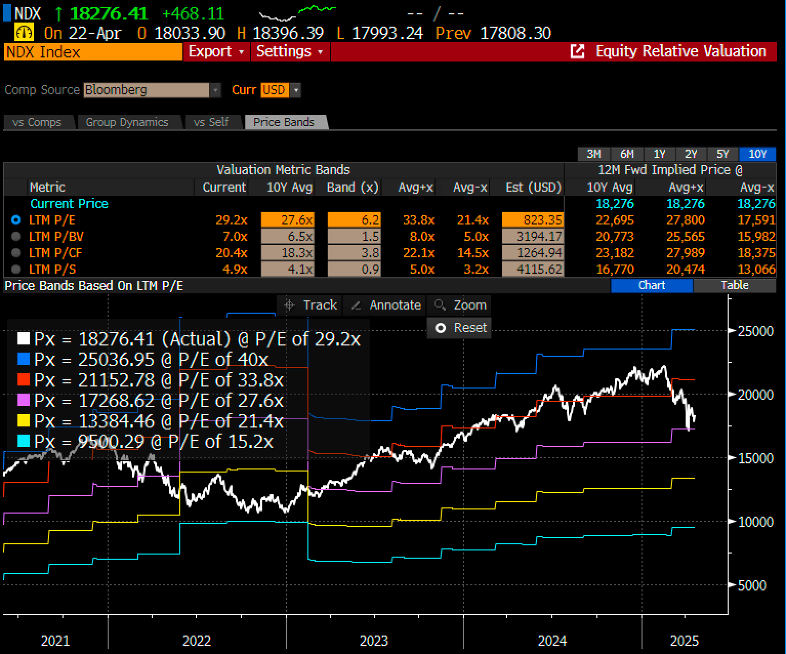
Given that the Nasdaq 100 is currently trading slightly above its 10-year average P/E ratio, it is neither considered expensive nor cheap at this point. However, disappointing earnings results and weaker forward guidance remain key risk factors that could trigger further market corrections.
Chart 4: Nasdaq100 is trading right above the average PE of its 10-year PE bands
April 23rd, 2025
William Yii
CIO, CP Global Fintech Solutions
– – –
Disclaimer: Airo is a brand of CP Global Fintech Solutions Sdn Bhd (“CPFS”), licensed by the Securities Commission of Malaysia as a Digital Investment Management company. CPFS is authorised to carry out the business of fund management incorporating innovative technologies into automated discretionary portfolio management services offered to clients under a license issued pursuant to Schedule 2 of the Capital Markets Services Act 2007.
All investing involves risk, including the possible loss of money you invest, and past performance does not guarantee future performance. Historical returns, expected returns, and probability projections are provided for informational and illustrative purposes, and may not reflect actual future performance. CPFS assumes no responsibility for liability for your trading and investment results. It should not be assumed that the methods, techniques, or indicators presented in these products will be profitable, or that they will not result in losses. Past results of any trading system published by CPFS, are not indicative of future returns by that system, and are not indicative of future returns which will be realized by you.

Highlights:
#1
February witnessed a notable correction in U.S. equities, with the S&P 500 declining by 1.42%. The technology sector was once again a major drag on performance, as the Nasdaq 100 fell by 2.76%. Smaller-cap stocks also faced significant pressure, with the Russell 2000 dropping by 5.45%.
#2
In comparison, the Airo-BOCA Composite outperformed the S&P 500, recording a smaller decline of just 0.72%. The relative outperformance was primarily driven by gains in long U.S. Treasuries and long Japanese Yen ETFs. On the other hand, the Airo-Shariah Composite fell by 1.82%, weighed down by its exposure to U.S. technology stocks.
#3
While market pundits remain focused on the uncertainty surrounding Trump’s proposed tariffs, we continue to monitor the broader macroeconomic backdrop–particularly the evolving trajectories of growth and inflation. Although U.S. inflation has continued to ease, it has come at the cost of a weakening macro growth outlook.
#4
On the micro front, Nvidia reported its Q4 2024 results with forward guidance that fell short of consensus’ expectations. More concerning for the broader U.S. technology sector is that the ‘Magnificent 7’ continue to pour billions into AI-related cloud and data centre driven capital expenditures–seemingly with little regard for the potential return on investment.
#5
On the emerging markets front, China appears to have bottomed, as evidenced by its strong recent rally–despite the broader correction in developed equity markets. For context, this upward trend began as early as April 2024, and we expect China to continue its relative outperformance over the medium term.
– – –
Dear Valued Investor,
Global equities experienced a notable correction in February, led by the U.S. market. The S&P 500 declined by 1.42% while the Nasdaq 100 and small-cap Russell 2000 fell by 2.76% and 5.45%, respectively. While market pundits were quick to attribute the pullback to tariff-related uncertainty under Trump, the reality is that valuations had become stretched following the strong rally that began in 2023. Even after the recent correction, the Nasdaq 100 remains more than one standard deviation above its 10-year average PE valuation band. A more reasonable near-term fair value would place it closer to its historical average.
Chart 1: Nasdaq100 barely corrected down to its +1-standard deviation band
In contrast, the Airo-BOCA Composite outperformed the S&P 500 in February, posting a smaller decline of just 0.72%. This relative resilience was primarily driven by gains in long U.S Treasuries and long Japanese Yen ETFs. Meanwhile, the Airo-Shariah Composite declined by 1.82%, largely due to its exposure to U.S. technology stocks, which weighed on performance.
Table 1: Airo-BOCA & Airo-Shariah Performance As Of February 2025


While market pundits remain fixated on the uncertainty surrounding Trump’s proposed tariffs, we continue to focus on the broader macroeconomic backdrop–particularly the evolving trajectories of growth and inflation. In recent months, U.S. inflation has continued to cool, as reflected in both Headline and Core CPI figures. On its own, moderating inflation is a good thing for the main street, offering some relief to the masses.
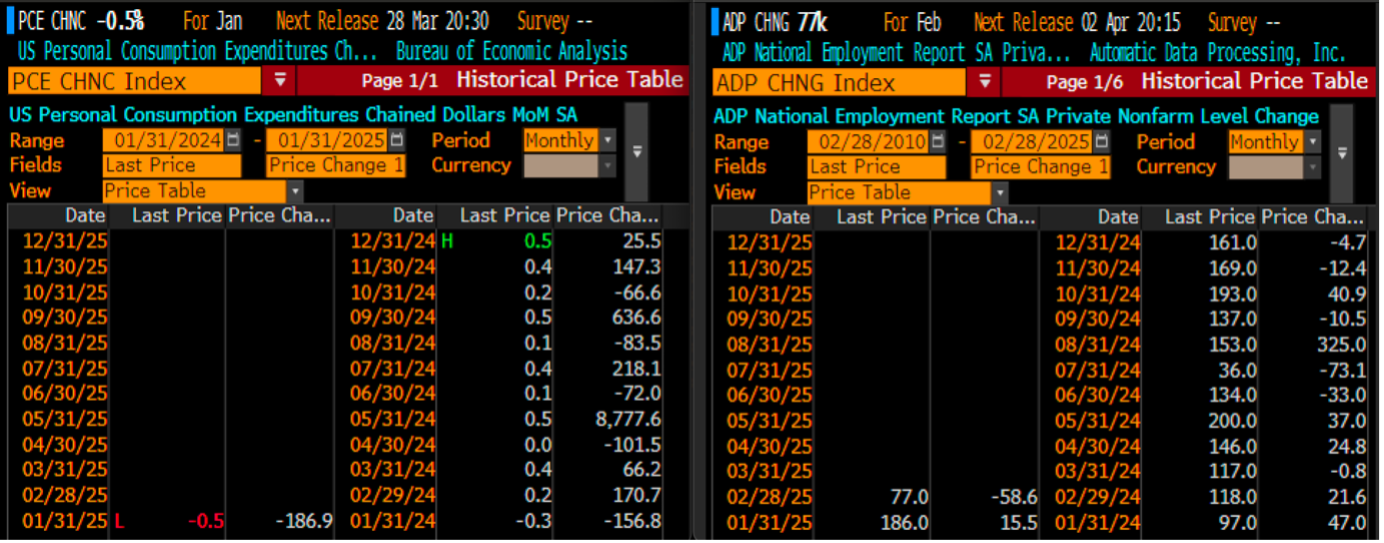
However, there are growing anecdotal signs that the recent cooling in inflation may have come at the expense of weakening economic growth. First, ISM Manufacturing New Orders plunged sharply into contraction territory, indicating negative growth concurrently as manufacturing costs surged. Second, real personal spending unexpectedly contracted for the first time since 2024. Third, private sector job openings–as measured by ADP–declined significantly in February. In short, the softer inflation figures appear to be a byproduct of a deteriorating macro growth trajectory, which is not a reassuring signal for the broader U.S. equity market.
Chart 2: ISM Manufacturing New Orders Plunged Sharply Into Contraction
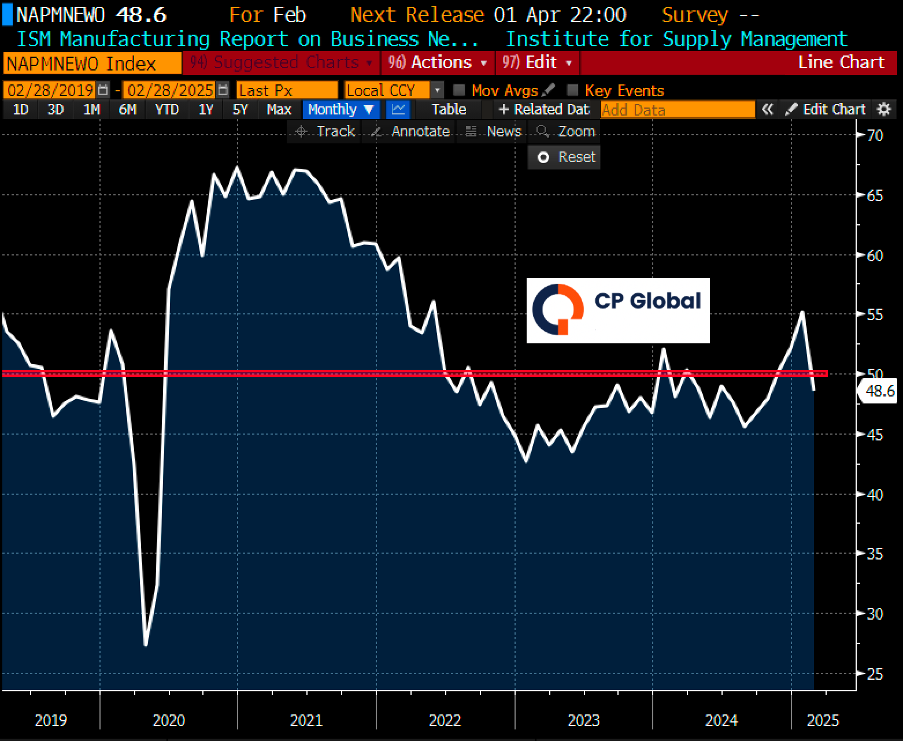
Table 2: Real Personal Spending vs. Private Payrolls ADP.
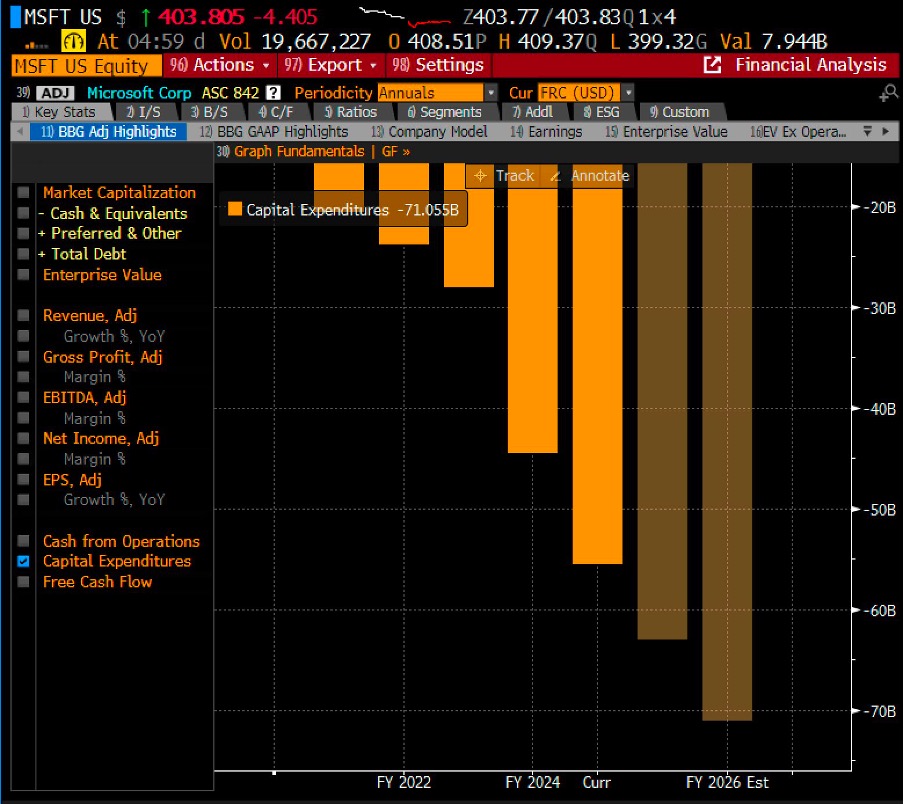
On the micro front, Nvidia reported its Q4 2024 results with forward guidance that fell short of consensus expectations. Specifically, its Q1 2025 revenue guidance came in at the lower end of the range around $43 billion versus the consensus’ estimate of $48 billion at the time. More concerning for the broader U.S. technology sector is the continued aggressive capital expenditure by the ‘Magnificent 7’ on AI-related cloud infrastructure and data centres, seemingly with limited consideration for near-term return on investment.
Chart 3: Amazon’s Capex Intentions
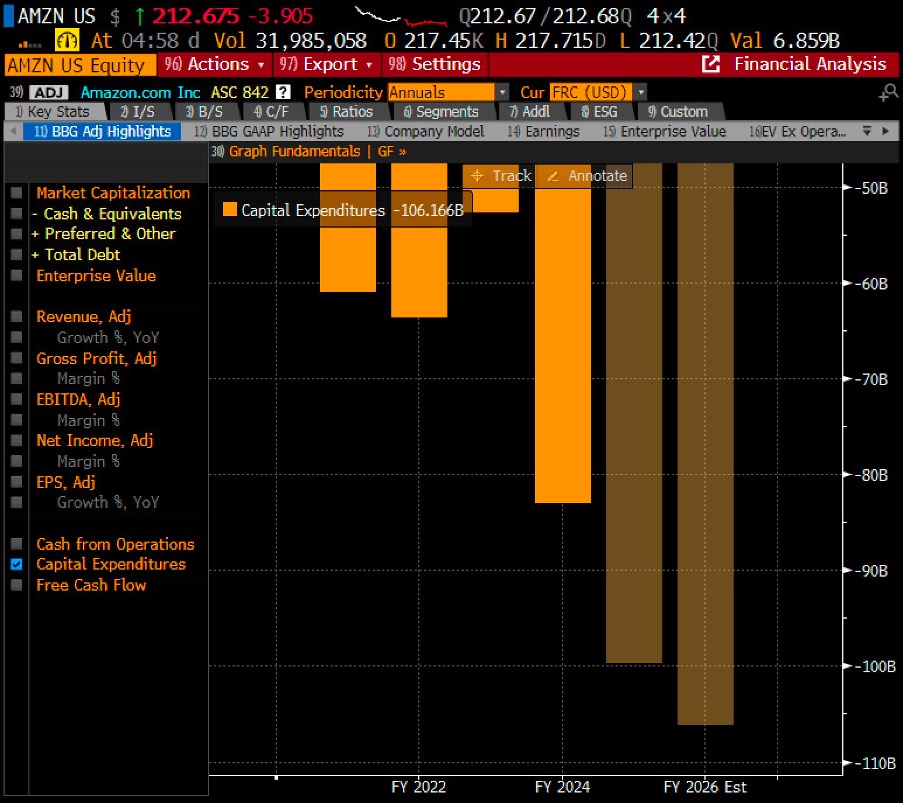
Chart 4: Alphabet’s Capex Intentions
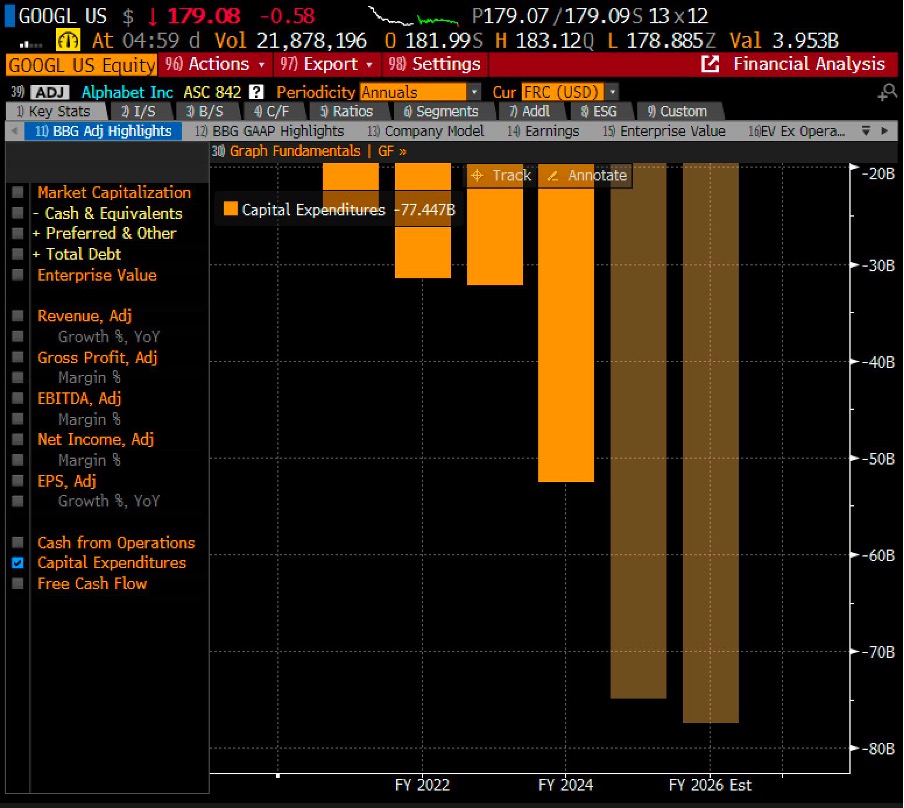
Chart 5: Microsoft’s Capex Intentions
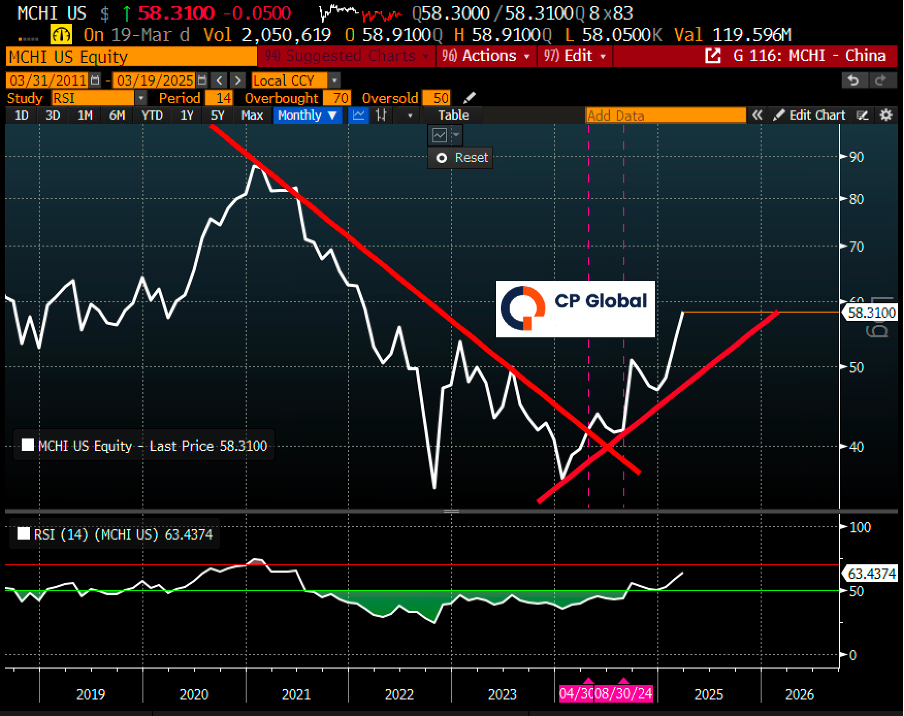
On the emerging markets front, China appears to have found a bottom, as evidenced by its recent strong rally–despite the broader correction in developed equity markets. For context, this upward momentum began as early as April 2024. Looking ahead, we expect China to continue its relative outperformance over the medium term.
Chart 6: China Had Actually Bottomed In April 2024
March 21st, 2025
William Yii
CIO, CP Global Fintech Solutions.
– – –
Disclaimer: Airo is a brand of CP Global Fintech Solutions Sdn Bhd (“CPFS”), licensed by the Securities Commission of Malaysia as a Digital Investment Management company. CPFS is authorised to carry out the business of fund management incorporating innovative technologies into automated discretionary portfolio management services offered to clients under a license issued pursuant to Schedule 2 of the Capital Markets Services Act 2007.
All investing involves risk, including the possible loss of money you invest, and past performance does not guarantee future performance. Historical returns, expected returns, and probability projections are provided for informational and illustrative purposes, and may not reflect actual future performance. CPFS assumes no responsibility for liability for your trading and investment results. It should not be assumed that the methods, techniques, or indicators presented in these products will be profitable, or that they will not result in losses. Past results of any trading system published by CPFS, are not indicative of future returns by that system, and are not indicative of future returns which will be realized by you.
Key Drivers Behind the Market Rally
The US stock market witnessed an exciting rally as the S&P 500 surged to a fresh record high, closing at 6,129.58. This remarkable movement occurred just 10 minutes before the market closed, marking the index’s first new high since January 23. The Dow Jones and Nasdaq futures also edged up slightly, with Nasdaq futures leading the gains at 0.2%.
Key Drivers Behind the Market Rally
The latest stock market movements were influenced by several key factors. President Donald Trump announced impending tariffs on automobile imports, expected to take effect as early as April 2, with a proposed 25% tariff impacting all foreign carmakers selling in the US. Additionally, similar duties may be imposed on semiconductors and pharmaceutical imports, further shaking market sentiment. Chipmaker Intel (INTC) experienced its biggest five-day gain in company history, driven by reports of two rivals considering deals that could lead to a company split. This speculation fueled investor optimism, pushing Intel’s stock higher. Artificial intelligence (AI) continues to drive stock market activity, with Super Micro Computer, Inc. (SMCI) climbing over 3% in after-hours trading, Palantir (PLTR) surging near an all-time high in extended market hours, while Meta (META) saw its 20-session winning streak end, leading to a slight decline in its stock value.
Market Outlook: What’s Next?
Investors are closely watching how the Federal Reserve’s cautious stance on interest rates will impact market momentum. With AI stocks driving optimism and geopolitical trade policies in play, market volatility is expected to remain high in the coming weeks.
Conclusion
The S&P 500’s record-breaking close signals strong market confidence, driven by tech sector movements and economic policy shifts. As tariff concerns loom and AI stocks continue to dominate, investors should stay informed and prepared for further market fluctuations.
Stay tuned for more stock market updates and investment insights!
Source: YahooFinance

Highlights:
#1
The initial selloff in early January triggered a buy-on-dip sentiment, as the market interpreted Trump’s tariff rhetoric as a short-term negotiation tactic in global trade discussions rather than a signal of outright escalation.
#2
As a result, the MSCI ACWI and S&P 500 indices closed higher, gaining +3.14% and +2.70%, respectively. The Airo-BOCA composite likewise returned positively at +0.71%, although overall performance was weighed down by certain hedging positions.
#3
From a macro perspective, key risk factors for global equity markets include Trump’s tariff rhetoric, persistent U.S. inflation, and Japan’s ongoing elevated inflation. Trump imposed several tariffs targeting both allies (Canada and Mexico) and rivals (China), although the actual implementation of these tariffs is delayed.
#4
Lastly, with Japan’s strong inflation and solid economic growth, a further appreciation of the Yen appears likely, as the Bank of Japan is expected to continue its interest rate hike normalization to curb rising inflationary pressures. However, as previously mentioned, a significantly stronger Yen raises the risk of a Yen carry trade unwinding, which could spark a global selloff in risk assets.
#5
On the micro front, U.S. corporations have released their 4Q 2024 earnings results. Notably, the ‘Magnificent 7’ delivered underwhelming performance, with management providing forward sales guidance that fell short of consensus expectations.
– – –
Dear Valued Investor,
Following the selling volatility in December 2024, financial markets extended the selloff into early January. However, sentiment shifted to a buy-on-dip mode from mid-January onward, driving U.S. markets higher by month-end. A key catalyst for the January rally was the market’s perception that Trump’s tariff threats were a short-term negotiating tactic used in global trade discussions rather than a signal of outright escalation.
As a result, the MSCI ACWI and S&P 500 indices closed higher, gaining +3.14% and +2.70%, respectively, as markets largely dismissed the tariff rhetoric as non-threatening for the time being. Similarly, the Airo-BOCA composite returned positively at +0.71%, though overall performance was weighed down by certain hedging positions. Looking ahead, the S&P 500’s price action suggests that an absolute peak for 2025 may arrive sooner rather than later, particularly as its price trend begins to diverge from its earnings growth trajectory.
Chart 1: S&P500 is potentially churning at its absolute peak in 2025
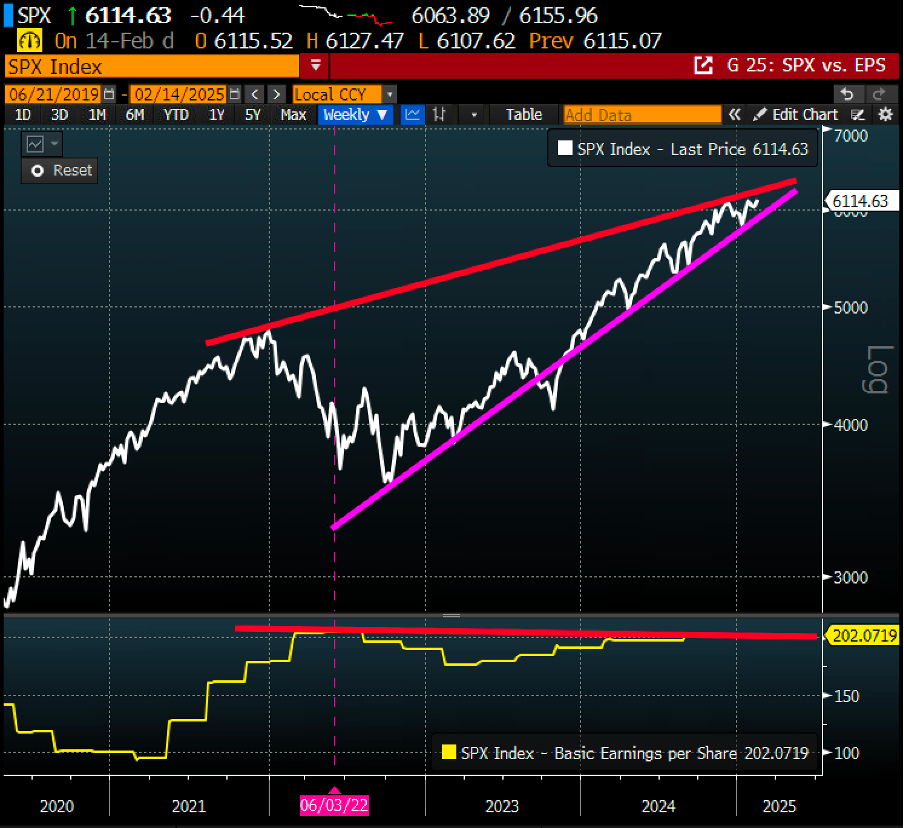
Table 1: Airo-BOCA Composite Return (January 2025)

From a macro perspective, key risk factors for global equity markets include Trump’s tariff rhetoric, persistent U.S. inflation, and Japan’s elevated inflation. Trump has approved several tariffs, including a 25% levy on imports from allies Canada and Mexico, and a proposed 10% tariff on certain Chinese commodities. However, with the tariff implementation still pending, Trump is providing counterparties ample time to negotiate. As a result, market participants are implicitly anticipating potential trade agreements rather than a full-scale tariff rollout.
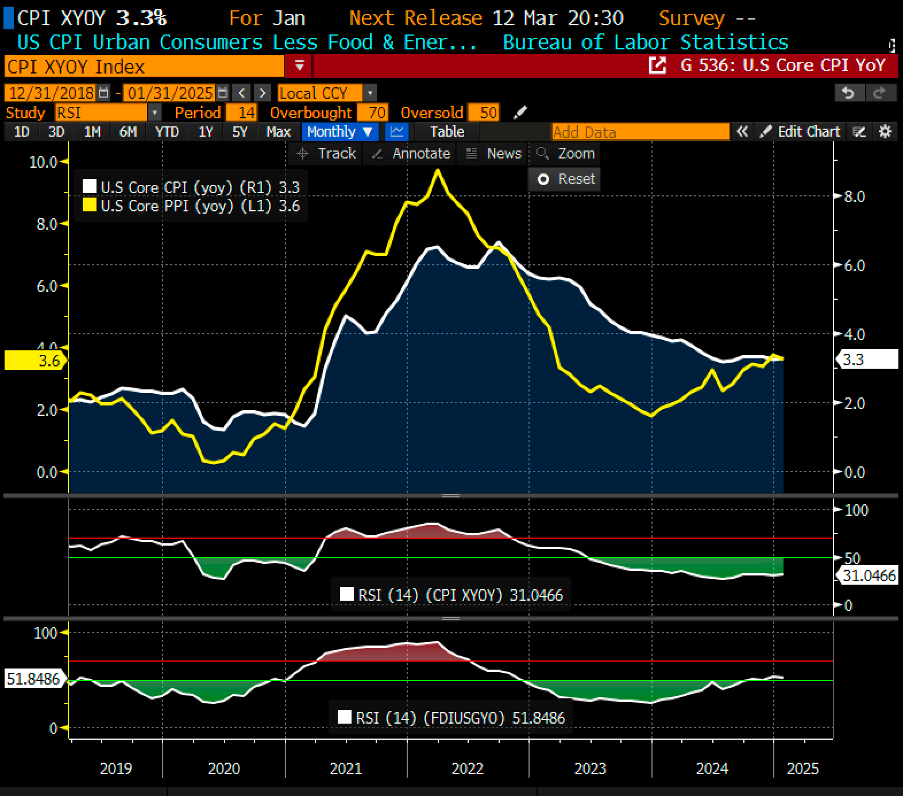
Regarding the U.S. inflation trajectory, January 2025’s headline Consumer Price Index (CPI) surged by +0.5% month-on-month, marking the highest increase since August 2023. Similarly, core CPI remained sticky, rising to 3.3% year-on-year. In addition, both headline and core Producer Price Index (PPI) figures reflected a more hawkish outlook, registering 3.5% and 3.6% year-on-year, respectively. In summary, these inflation indicators suggest that the Fed.’s preferred inflation gauge i.e. the core Personal Consumption Expenditure (PCE) deflator may turn out to be just as hawkish. If this trend persists, not only will the probability of a rate cut continue to diminish, but expectations could shift toward the possibility of a rate hike instead!
Chart 2: Both U.S Core CPI & Core PPI are turning higher above 3.0% yoy
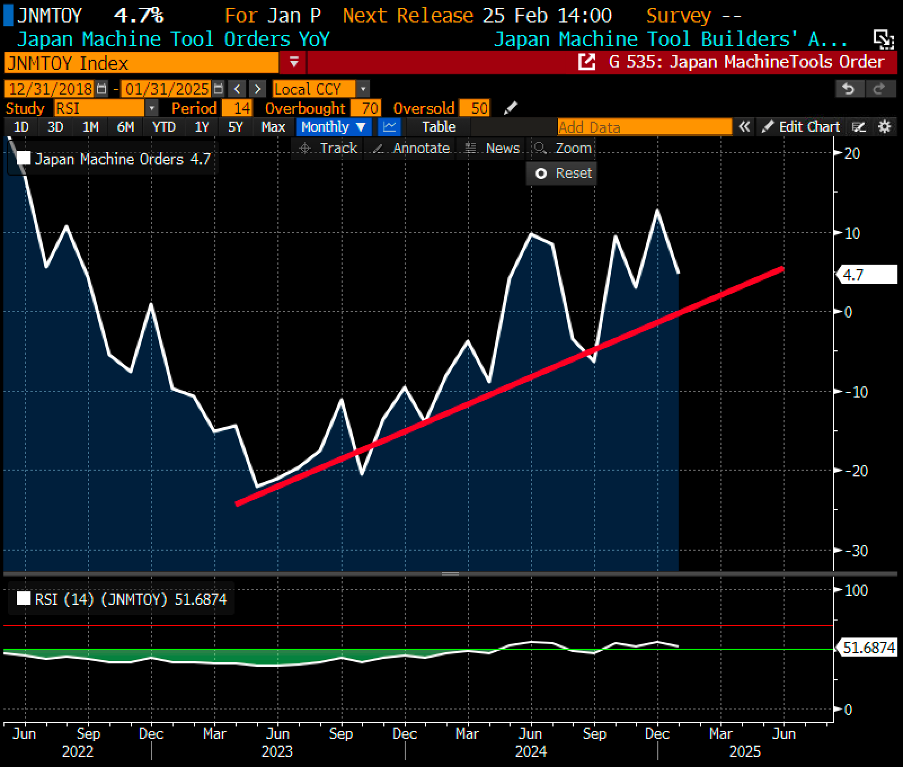
Japan’s inflation and growth data remain robust, with core CPI and headline PPI continuing to rise strongly above +3% year-on-year, while growth indicators, such as machinery orders, show steady expansion. Additionally, Japan’s 4Q 2024 GDP growth surprised to the upside, accelerating to an annualized 2.8%, up from 1.2% in 3Q 2024! In summary, Japan’s solid macroeconomic data further support the Bank of Japan’s efforts to normalize interest rates, aiming to tackle inflationary pressures more effectively from the current interest rate of just 0.50%.
Chart 3: Japan Core CPI & Core PPI are trending up consistently at 3.0% yoy & above
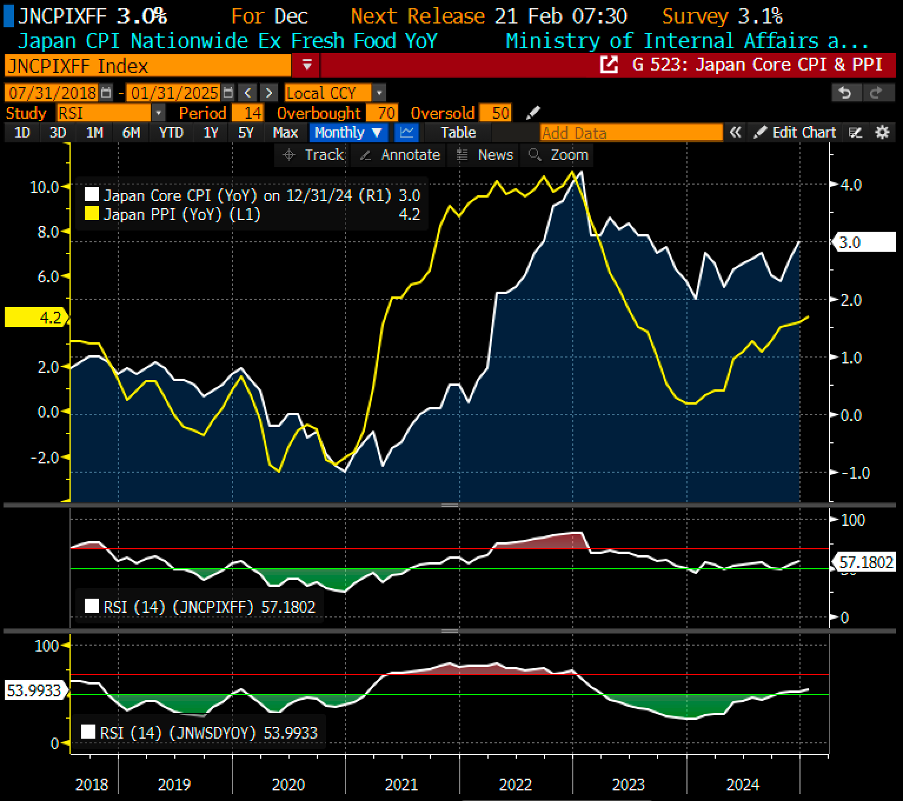
Chart 4: Japan machinery order has been growing consistently
It is important to emphasize once again that while a continuous interest rate hike is typically bullish for the Yen, its impact on Japanese equities may be far less favorable. For years, Japan’s relatively weaker Yen against other currencies has fueled carry trade investments. Therefore, a prolonged unwinding of the Yen as a carry trade currency poses a clear and present danger to global risk assets, as it could potentially trigger another selloff in Japanese equities–or even a broader global equity market decline.
Chart 5: Market consensus is expecting USDJPY to hit 148 by the end of 2025
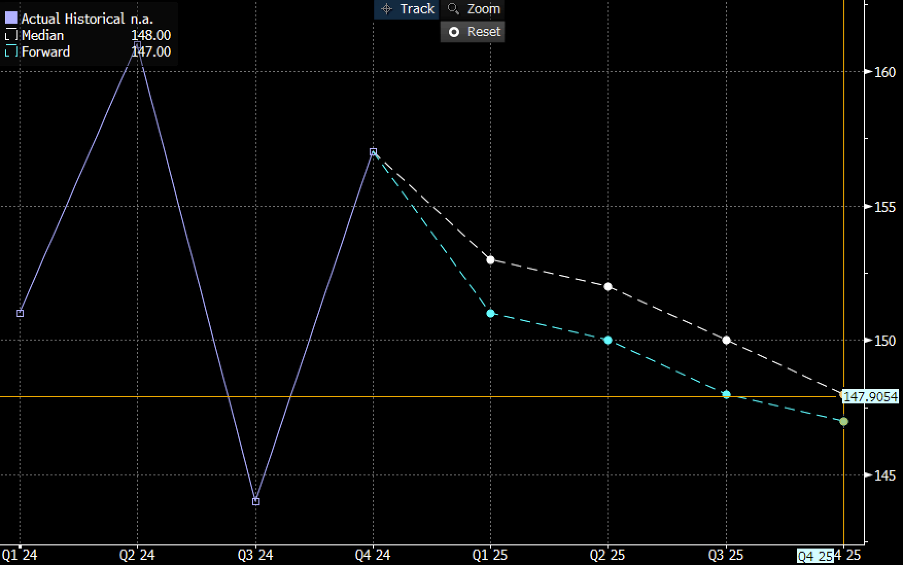
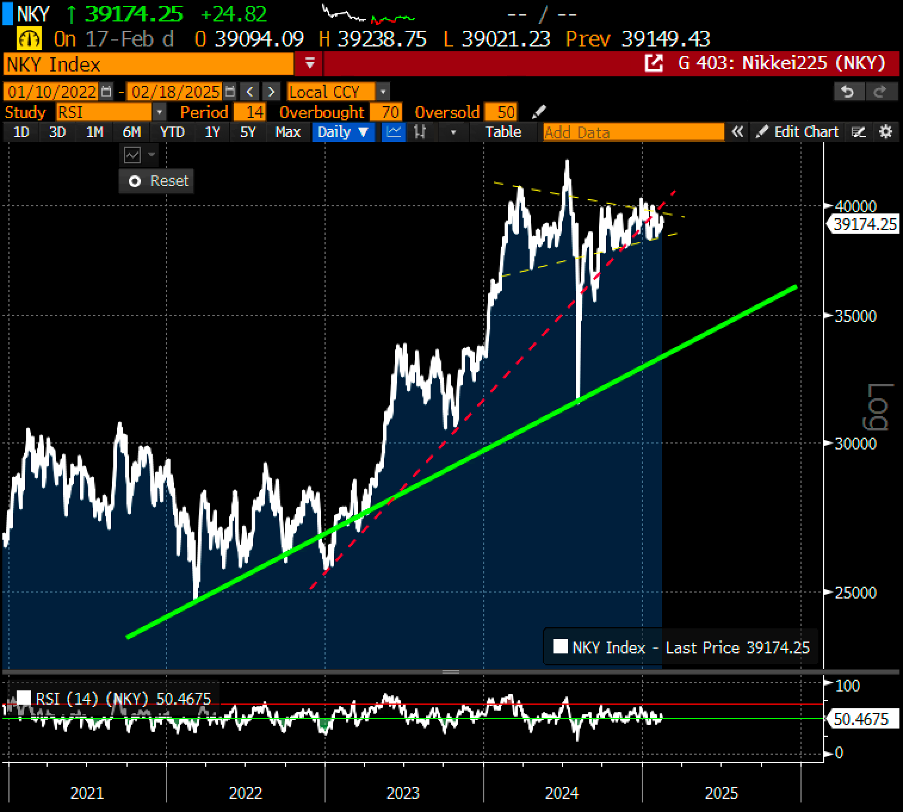
Chart 6: Nikkei225 remains in a tight range that is awaiting a breakout. But, which way?
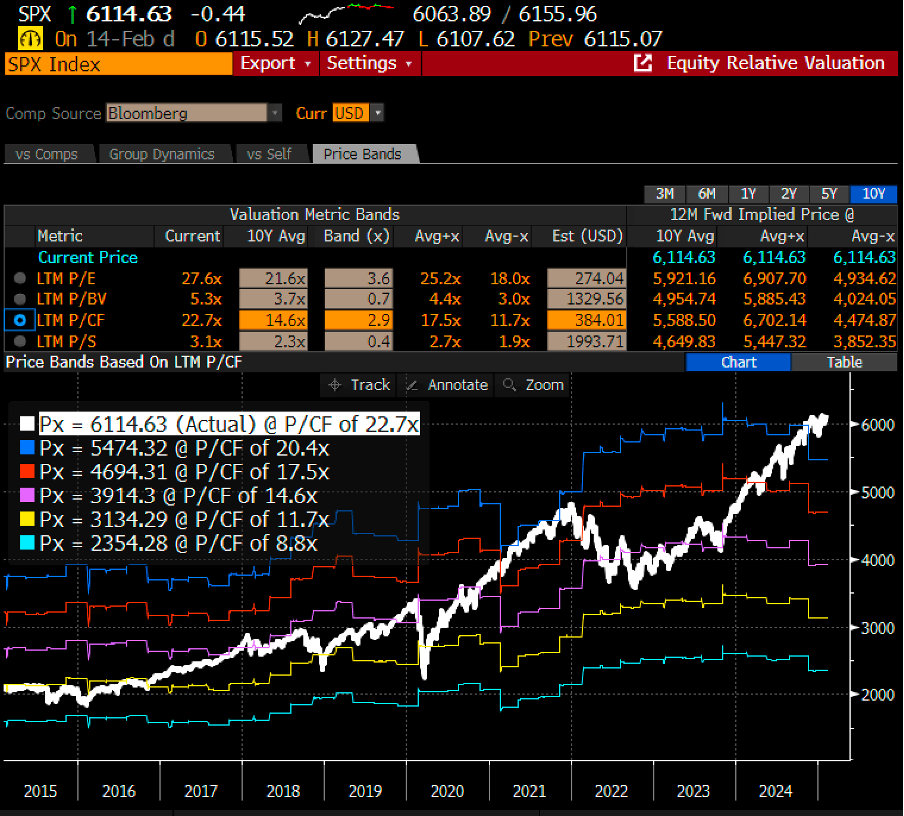
Lastly, on the micro front, U.S. corporations have released their 4Q 2024 earnings results. Notably, the ‘Magnificent 7’ delivered underwhelming management guidance, with forward revenue projections falling short of consensus expectations. This highlights a clear dislocation between a weaker earnings outlook and the current S&P 500 valuation, which remains at the upper end of its historical bands across multiple metrics, including price-to-earnings (P/E), price-to-book (P/B), price-to-cash flow (P/C), and price-to-sales (P/S) ratios.
Chart 7: S&P500 is trading circa +2-sigma of its 10Y average P/E band
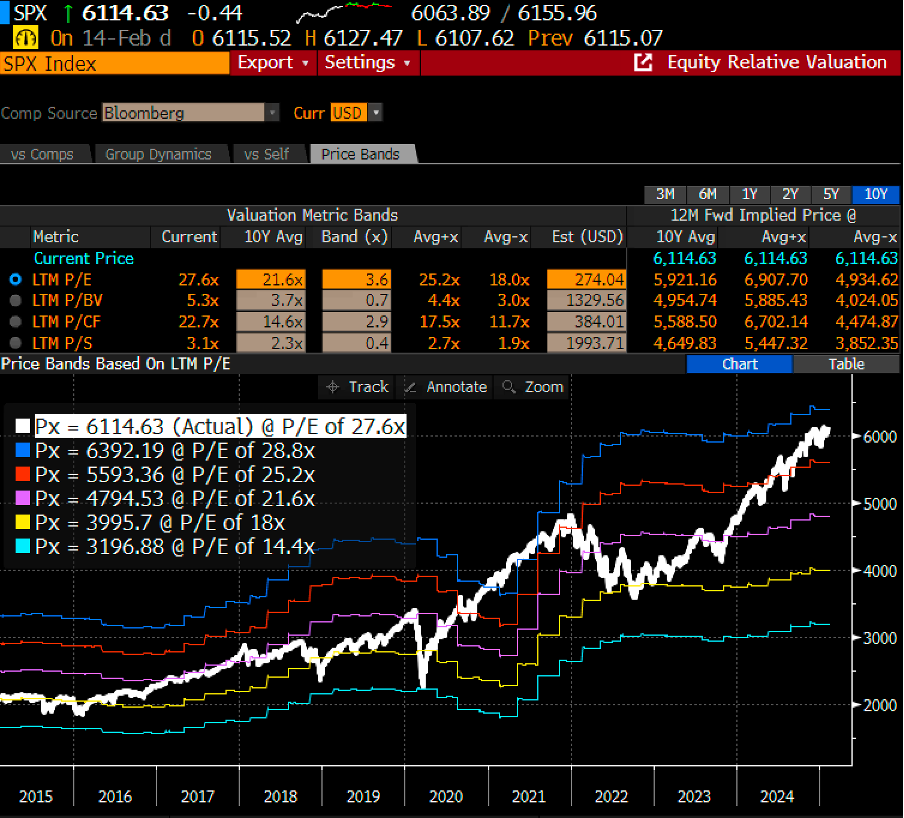
Chart 8: S&P500 is trading above the +2-sigma of its 10Y average P/S band
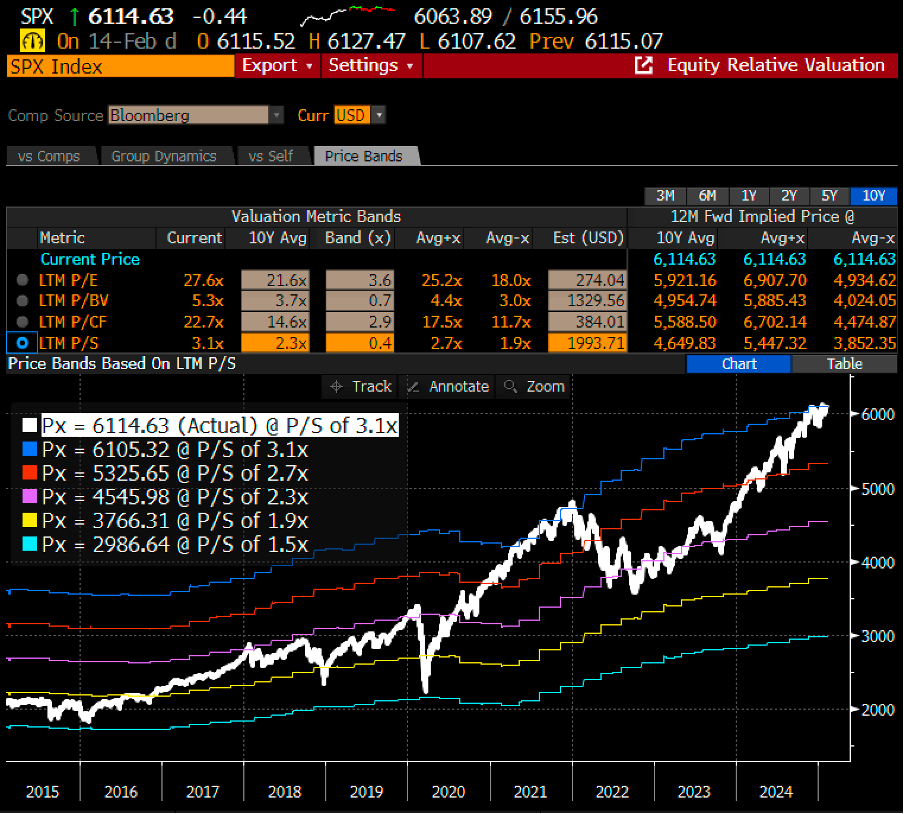
Chart 9: S&P500 is trading above the +2-sigma of its 10Y average P/CF band
February 18th, 2025
William Yii
CIO, CP Global Fintech Solutions.
– – –
Disclaimer: Airo is a brand of CP Global Fintech Solutions Sdn Bhd (“CPFS”), licensed by the Securities Commission of Malaysia as a Digital Investment Management company. CPFS is authorised to carry out the business of fund management incorporating innovative technologies into automated discretionary portfolio management services offered to clients under a license issued pursuant to Schedule 2 of the Capital Markets Services Act 2007.
All investing involves risk, including the possible loss of money you invest, and past performance does not guarantee future performance. Historical returns, expected returns, and probability projections are provided for informational and illustrative purposes, and may not reflect actual future performance. CPFS assumes no responsibility for liability for your trading and investment results. It should not be assumed that the methods, techniques, or indicators presented in these products will be profitable, or that they will not result in losses. Past results of any trading system published by CPFS, are not indicative of future returns by that system, and are not indicative of future returns which will be realized by you.
The Malaysian ringgit started the day on a firmer footing against the US dollar, opening at 4.4675/4.4745, compared to the previous day’s close of 4.4680/4.4725. This slight gain came despite a higher-than-expected US inflation report, which had the potential to strengthen the greenback.
Why Did the Ringgit Strengthen?
The US consumer price index (CPI) for January recorded a rise of 3.0%, while the core CPI climbed 3.3%, both surpassing market expectations of 2.9% and 3.1%, respectively. However, the US Dollar Index (DXY) remained largely unmoved, providing some breathing space for the ringgit. This suggests that despite inflationary pressures, the market sentiment towards the US dollar remained neutral, allowing the ringgit to gain marginally.
US Federal Reserve’s Influence on the Market
According to Bank Muamalat Malaysia Bhd chief economist Afzanizam Rashid, the recent inflation data further reinforced expectations that the US Federal Reserve (Fed) is not in a hurry to cut interest rates. Fed Chair Jerome Powell emphasized that achieving price stability remains a priority, signaling that the central bank will maintain its cautious stance on monetary policy. This outlook implies that the US dollar may continue to hold its strength, which could limit the ringgit’s upside in the near future.
What’s Next for the Ringgit?
While the ringgit has managed to open stronger, its future trajectory remains uncertain. The Fed’s interest rate policy and potential US trade policy changes could influence the demand for the US dollar, indirectly affecting the ringgit’s performance. For now, investors should keep an eye on further economic data releases and global market trends to anticipate the currency’s movement. Despite a muted DXY, the ringgit saw slight gains against the US dollar, reflecting a cautious market reaction to US inflation data. However, with the Fed’s firm stance on interest rates, the local currency’s long-term strength will depend on broader economic and policy developments. Investors should remain vigilant and stay informed about the latest financial trends.
Source: Free Malaysia Today
Asian stocks rose as investors navigated through ongoing US-China trade tensions and earnings reports from Wall Street’s major tech companies. However, Chinese shares edged lower, and Hong Kong equities fell, while stocks in Australia and Japan advanced. Meanwhile, US equity contracts also dipped as Alphabet Inc. and Advanced Micro Devices Inc. saw declines in extended trading. Treasury yields moved higher.
US-China Trade War: A New Chapter
The latest developments in the US-China trade war signal a more measured approach from Chinese President Xi Jinping compared to his stance during Donald Trump’s first term. Beijing’s swift yet tempered retaliation to the US’s 10% tariff suggests an effort to avoid a full-blown economic standoff. However, weaker-than-expected manufacturing activity data and the yuan’s depreciation are raising concerns over Chinese stocks’ performance.
China continued its efforts to stabilize the yuan, setting the daily reference rate at a level stronger than 7.2 per dollar amid increased depreciation pressure due to trade disputes. Goldman Sachs projects that the MSCI China Index could rise by 14% by year-end as Beijing rolls out anticipated policy stimulus.
Retaliation and Market Responses
Following a last-minute reprieve granted to Canada and Mexico, Trump’s tariffs on China officially took effect at midnight Washington time on Tuesday. In response, Beijing swiftly announced additional tariffs on approximately 80 US products, effective February 10. Furthermore, China launched an antitrust investigation into Google, tightened export controls on critical minerals, and added two US firms to its list of unreliable entities. Trump, in a statement, said there is no immediate rush to engage in discussions with Xi Jinping but would do so at an appropriate time.
Other Market Movements
Elsewhere in Asia, Japan’s central bank is expected to continue raising its benchmark rate beyond current market expectations, according to a former executive director at the Bank of Japan. This anticipation led to a rise in the yen, which advanced to around 154 per dollar on Tuesday.
In the commodities sector, oil prices edged lower amid fears that the prolonged trade war could negatively impact global economic growth. Meanwhile, US stock indexes rebounded after a wave of dip-buying, with Bloomberg’s gauge of the “Magnificent Seven” megacaps climbing by 1.7%.
Bottom Line
Despite trade tensions, Asian markets demonstrated resilience, with Australia and Japan leading the gains. However, China’s stock market remains under pressure due to ongoing economic concerns and a weakening yuan. Investors are keeping a close eye on potential policy stimulus from Beijing, which could play a crucial role in shaping market trends in the coming months.
Source: YahooFinance